. 2022 Oct 14;11(20):3219.
doi: 10.3390/cells11203219.

Activity and Stability of Panx1 Channels in Astrocytes and Neuroblastoma Cells Are Enhanced by Cholesterol Depletion

Affiliations

Activity and Stability of Panx1 Channels in Astrocytes and Neuroblastoma Cells Are Enhanced by Cholesterol Depletion

Antonio Cibelli et al. Cells. .

Abstract

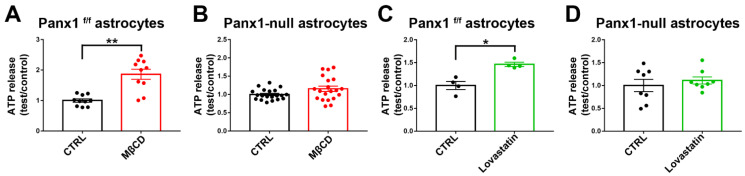
Pannexin1 (Panx1) is expressed in both neurons and glia where it forms ATP-permeable channels that are activated under pathological conditions such as epilepsy, migraine, inflammation, and ischemia. Membrane lipid composition affects proper distribution and function of receptors and ion channels, and defects in cholesterol metabolism are associated with neurological diseases. In order to understand the impact of membrane cholesterol on the distribution and function of Panx1 in neural cells, we used fluorescence recovery after photobleaching (FRAP) to evaluate its mobility and electrophysiology and dye uptake to assess channel function. We observed that cholesterol extraction (using methyl-β-cyclodextrin) and inhibition of its synthesis (lovastatin) decreased the lateral diffusion of Panx1 in the plasma membrane. Panx1 channel activity (dye uptake, ATP release and ionic current) was enhanced in cholesterol-depleted Panx1 transfected cells and in wild-type astrocytes compared to non-depleted or Panx1 null cells. Manipulation of cholesterol levels may, therefore, offer a novel strategy by which Panx1 channel activation might modulate various pathological conditions.

Keywords: ATP release; P2X7R; Panx1; brain; cell biology; cholesterol; cyclodextrins; fluorescence recovery after photobleaching; membrane fluidity; membrane lipids.


Conflict of interest statement

The authors declare no conflict of interest.

Figures

Figure 1
Figure 1
Expression of endogenous Panx1 is largely absent in CRISPR-deleted N2a cells. Representative confocal images obtained from (A) parental, (B) Panx1-deleted, and (C) Panx1-deleted N2a cells expressing human (h) Panx1 construct. Boxed white areas show the Panx1 staining at higher magnification. Scale bars: 50 μm lower magnification, 20 μm in boxed areas.
Figure 2
Figure 2
Effects of temperature on the lateral diffusion of mPanx1-GFP protein. N2a cells transiently expressing mPanx-1-GFP were subjected to FRAP at 37 °C (A) and 25 °C (B). Images were obtained at indicated time points after photobleaching. Magnification scale bars: 10 µm; insets show FRAP regions. (C) Cumulative FRAP curves showing more rapid recovery at 37 °C than 25 °C. (C,D) Histograms of normalized FRAP recovery at 15, 30, and 60 s after photobleach. Each curve represents the average of 7–10 cells. p values were obtained using unpaired Student’s t test. Data collected over three independent repeats. Bars represent mean ± SEM. * p < 0.05.
Figure 3
Figure 3
Effects of treatment with MβCD and lovastatin on membrane cholesterol level, Panx1 extraction, and cell viability. (A) mPanx-1-GFP transfected N2a cells were incubated with cyclodextrin (5 mM MβCD and 10 mM MβCD for 60 min at 37 °C), lovastatin (5 μM, 12 h) in serum-free DMEM or with cholesterol (2 h, 37 °C). Washed membrane fractions were assayed for cholesterol with results normalized with respect to the protein content of the membrane fraction. Bars show mean ± SEM of replicates of three experiments. (B) Effects of MβCD and lovastatin in medium of Panx1 cells. (C) Effects of MβCD, lovastatin, and cholesterol on cell viability of mPanx1-GFP transfected N2a cells measured by MTT assay after treatments. p values obtained from ANOVA test followed by Dunnett’s test. Results are representative of three independent experiments ± SEM.* p < 0.05, ** p < 0.01, *** p < 0.001.
Figure 4
Figure 4
Cholesterol depletion reduces lateral mobility of Panx1 in the membrane. N2a cells transiently expressing mPanx-1-GFP were subjected to treatment with 5 mM methyl-β-cyclodextrin (MβCD), 5 mM MβCD followed by addition of cholesterol (MβCD + Chol) or left untreated (CTRL). (AC) Fluorescence images of transfected cells (control and treated with MβCD alone or with cholesterol) before (pre-bleach) and at 0.6 and 60 s postbleach; bleached regions are shown at higher magnification in insets. Bars: 10 μm; inset magnification 3×. (D) FRAP recovery curves for control cells and with MβCD alone or with cholesterol. (E) Histograms of normalized FRAP recovery at 15, 30, and 60 s after photobleach. p values obtained from ANOVA test followed by Dunnett’s test. n = 7–10 per plasma membrane domain, data collected over four independent repeats. ** p < 0.01.
Figure 5
Figure 5
Cholesterol depletion reduces lateral diffusion of mPanx-1-GFP in Panx1-null astrocytes. (A) Panx1-null astrocytes transiently expressing mPanx-1-GFP were subjected to treatments with 5 mM methyl-β-cyclodextrin (MβCD), 5 mM MβCD followed by addition of cholesterol (MβCD + Chol) or left untreated (CTRL). Typical FRAP curves of the lateral diffusion of mPanx1-GFP and its modulation by the various treatments are depicted in A. mPanx1-GFP lateral diffusion rates were reduced by MβCD (B). Normal diffusion was restored when cholesterol was added. (* p < 0.05). Bars: 10 μm. p values obtained from ANOVA followed by Dunnett’s test. n = 7–10 per plasma membrane domains; data collected over four independent repeats.
Figure 6
Figure 6
Cholesterol depletion by lovastatin impairs lateral mobility of mPanx1-GFP. (A) Fluorescence micrographs of N2a cells transiently transfected with mPanx1-GFP showing FRAP results before and after FRAP in normal medium and (B) after 12 h treatment with 5 µM lovastatin. Bars: 10 μm; insets in each panel are higher magnification of FRAP area (3×). (C) FRAP recovery curves obtained after treatment with 1, 5, and 20 µM lovastatin. (D) Normalized FRAP recovery at 15, 30, and 60 s after photobleach. p values obtained from ANOVA followed by Dunnett’s test. Each curve represents the average from 7 to 10 cells. Data collected over four independent repeats. Error bars are SEM. * p < 0.05, ** p < 0.01, *** p < 0.001.
Figure 7
Figure 7
Panx1 channels mediate dye uptake in cholesterol-depleted cell plasma membrane of N2a cells. (A) Representative photomicrographs of mPanx1 transfected and Panx1-null. (C) N2a cells showing EthBr uptake after MβCD and lovastatin with and without 100 µM BzATP treatment. Scale bar: 100 µm. (B,D) Mean ± SEM values of the relative EthBr fluorescence intensity. Values were normalized to those obtained under control conditions. Each point on the graphs represents the mean values of relative EthBr fluorescence changes recorded from all cells present in a field of view obtained from 3–5 independent experiments. p values obtained from ANOVA followed by Dunnett’s test. * p < 0.05, ** p < 0.01, *** p < 0.001.
Figure 8
Figure 8
Cholesterol depletion enhances dye uptake through Panx1 channels in astrocytes. (A) Fluorescence micrographs of intracellular EthBr in normal conditions (CTRL) and after treatment with MβCD, BzATP, or with both drugs. Scale bar: 100 µm. (B) EthBr uptake in Panx1-null astrocytes induced by MβCD with and without BzATP. Scale bar: 100 µm. (C) Histograms showing relative EthBr uptake compared to controls for treatment with MβCD alone or together with BzATP. (D) Mean ± SEM values of the relative EthBr fluorescence intensity obtained from Panx1-null astrocytes after MβCD, 100 µM BzATP, and MβCD with BzATP treatment. Values were normalized to those obtained under control conditions. In (C,D), each bar on the graphs represents mean value of relative EthBr fluorescence changes recorded from all cells present in a field of view obtained from 3–5 independent experiments. p values obtained from ANOVA test followed by Dunnett’s test. *** p < 0.001, **** p < 0.0001.
Figure 9
Figure 9
Human Panx1 conductance is activated by cholesterol depletion. (A,B) Electrophysiological recordings obtained from N2a cells expressing hPanx1 subjected to treatment with 5 mM MβCD (A,D) and 5 µM lovastatin (B,E). Note that N2a hPanx-1 transfected cells responded to cholesterol depletion with increased current amplitudes (red and green curves, in A and B, respectively) in response to 5.5 s-long voltage ramps from −60 to +80 mV compared to untreated cells, CTRL (black curves). Mean ± SEM values of the fold changes in peak conductance induced by 5 mM MβCD and 10 µM lovastatin obtained for N2a hPanx1 transfected cells are shown in parts (C,D), respectively. p values were obtained using Mann–Whitney tests. n = 10–11 cells. ** p < 0.01, *** p < 0.001. Traces in (C) and quantification in (F) correspond to recordings obtained from the Panx1null cells with and without MβCD treatment.
Figure 10
Figure 10
Panx1 channels mediate ATP release from cultured cholesterol depleted astrocytes. Histograms showing the ATP release from cultured Panx1f/f and Panx1-null astrocytes induced by cholesterol depletion with 5 mM MβCD (A,B) and 10 µM lovastatin (C,D). Bar histogram of the mean ± SEM values of ATP release from cultured Panx1f/f and Panx1 null astrocytes induced by cholesterol depletion. p values were obtained using Mann–Whitney tests. Data are from 2–3 independent experiments. * p < 0.05, ** p < 0.01.

References

    1. Panchin Y., Kelmanson I., Matz M., Lukyanov K., Usman N., Lukyanov S. A ubiquitous family of putative gap junction molecules. Curr. Biol. 2000;10:R473–R474. doi: 10.1016/S0960-9822(00)00576-5. - DOI - PubMed
    1. Baranova A., Ivanov D., Petrash N., Pestova A., Skoblov M., Kelmanson I., Shagin D., Nazarenko S., Geraymovych E., Litvin O., et al. The mammalian pannexin family is homologous to the invertebrate innexin gap junction proteins. Genomics. 2004;83:706–716. doi: 10.1016/j.ygeno.2003.09.025. - DOI - PubMed
    1. Swayne L.A., Bennett S.A. Connexins and pannexins in neuronal development and adult neurogenesis. BMC Cell Biol. 2016;17((Suppl. 1)):10. doi: 10.1186/s12860-016-0089-5. - DOI - PMC - PubMed
    1. Chiu Y.H., Schappe M.S., Desai B.N., Bayliss D.A. Revisiting multimodal activation and channel properties of Pannexin 1. J. Gen. Physiol. 2018;150:19–39. doi: 10.1085/jgp.201711888. - DOI - PMC - PubMed
    1. Wang J., Ambrosi C., Qiu F., Jackson D.G., Sosinsky G., Dahl G. The membrane protein Pannexin1 forms two open-channel conformations depending on the mode of activation. Sci. Signal. 2014;7:ra69. doi: 10.1126/scisignal.2005431. - DOI - PMC - PubMed

Publication types

MeSH terms