. 2022 Oct 14;11(20):3231.
doi: 10.3390/cells11203231.

The C-Terminus of the PSMA3 Proteasome Subunit Preferentially Traps Intrinsically Disordered Proteins for Degradation

Affiliations

The C-Terminus of the PSMA3 Proteasome Subunit Preferentially Traps Intrinsically Disordered Proteins for Degradation

Assaf Biran et al. Cells. .

Abstract

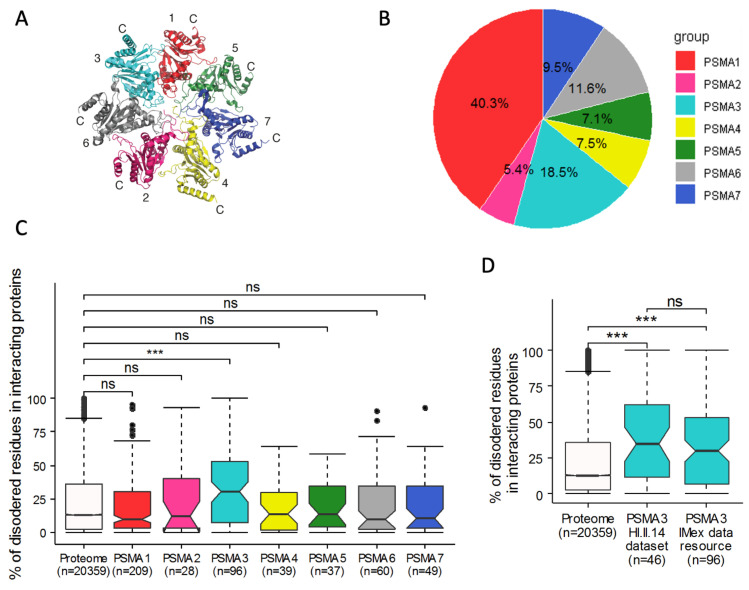
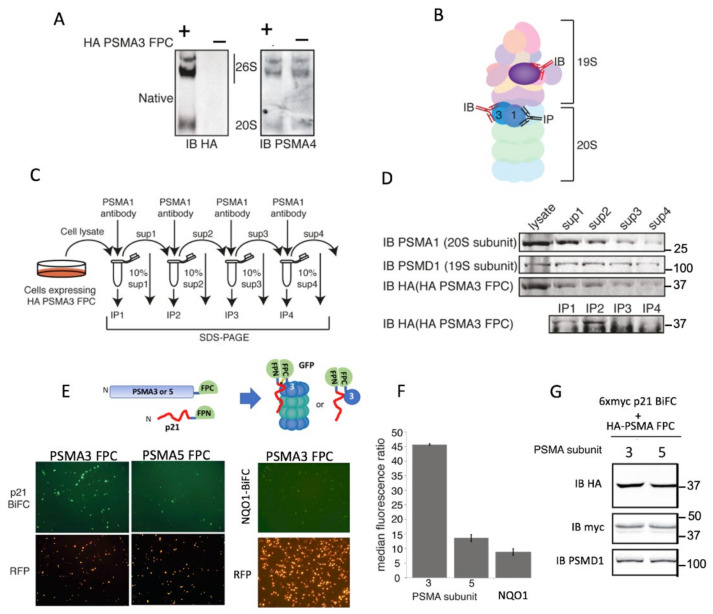
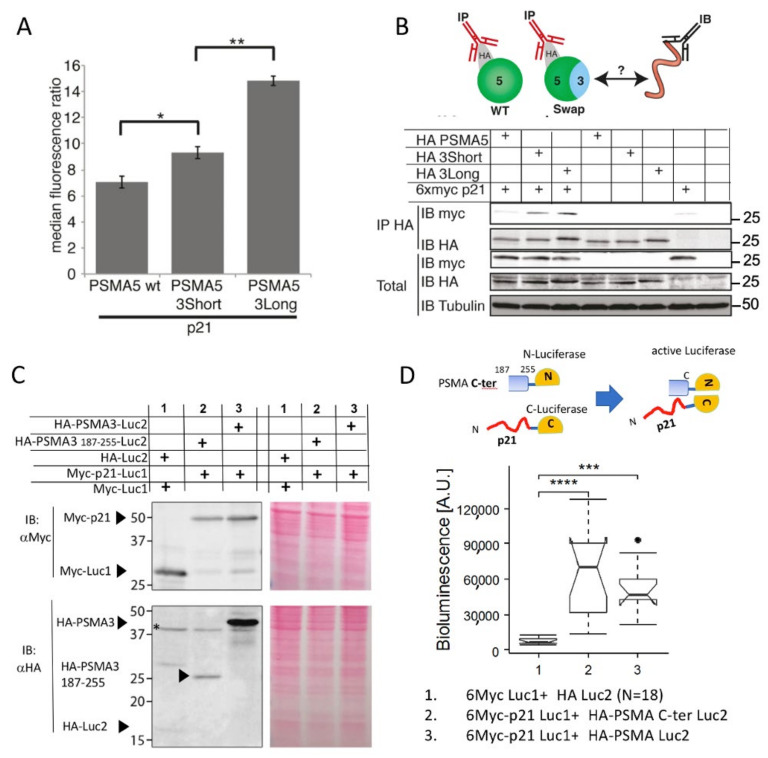
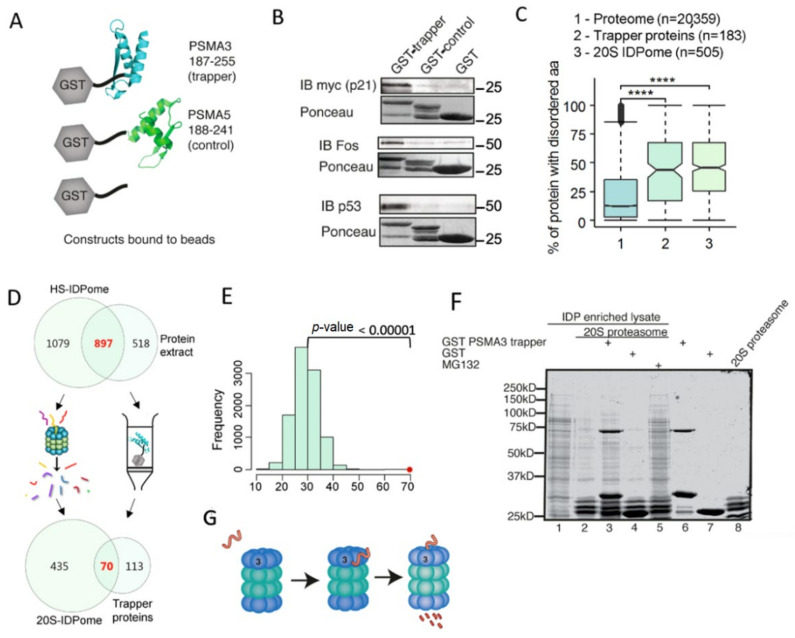
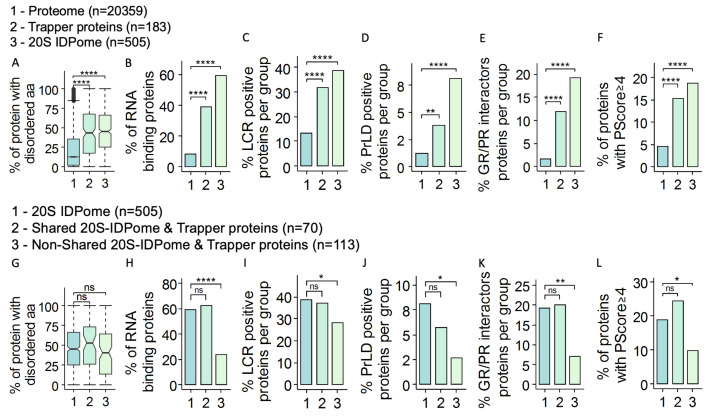
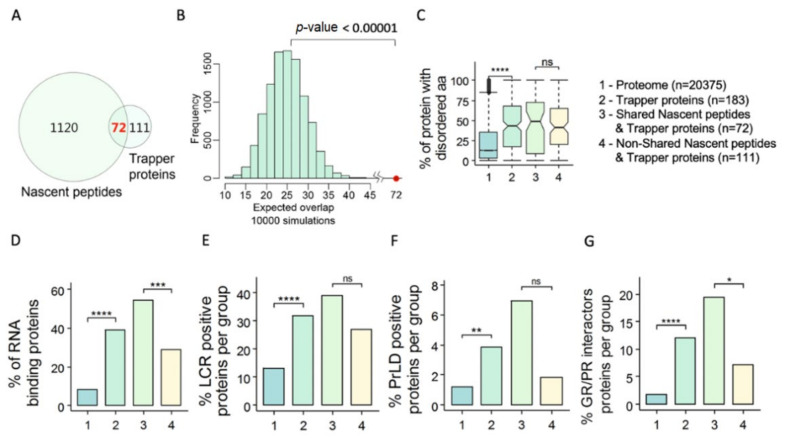
The degradation of intrinsically disordered proteins (IDPs) by a non-26S proteasome process does not require proteasomal targeting by polyubiquitin. However, whether and how IDPs are recognized by the non-26S proteasome, including the 20S complex, remains unknown. Analyses of protein interactome datasets revealed that the 20S proteasome subunit, PSMA3, preferentially interacts with many IDPs. In vivo and cell-free experiments revealed that the C-terminus of PSMA3, a 69-amino-acids-long fragment, is an IDP trapper. A recombinant trapper is sufficient to interact with many IDPs, and blocks IDP degradation in vitro by the 20S proteasome, possibly by competing with the native trapper. In addition, over a third of the PSMA3 trapper-binding proteins have previously been identified as 20S proteasome substrates and, based on published datasets, many of the trapper-binding proteins are associated with the intracellular proteasomes. The PSMA3-trapped IDPs that are proteasome substrates have the unique features previously recognized as characteristic 20S proteasome substrates in vitro. We propose a model whereby the PSMA3 C-terminal region traps a subset of IDPs to facilitate their proteasomal degradation.

Keywords: 20S proteasome; intrinsically disordered proteins; proteasomal degradation; proteostasis.


Conflict of interest statement

The authors declare no conflict of interest.

Figures

Figure 1
Figure 1
PSMA3 preferentially interacts with IDPs. (A) Crystal structure of PSMA ring [38]. PSMA subunits are identified by numbers. The N termini of the PSMA subunits protrude into the center of the ring, forming a gate restricting access into the 20S proteasome. (B) Pie chart presenting identified protein interactions of each PSMA subunit as a percentage of all identified protein interactions with PSMA subunits. We used the IMEx data resource to assemble an interaction list for the subunits. (C,D) Boxplot presenting the fraction of disordered residues found in the interacting proteins’ sequences. Non-overlapping notches provide a 95% confidence level that medians differ. Disordered residues were predicted with the IUPred algorithm. (C) Comparison of the level of disorder in proteins interacting with different PSMA subunits using IMEx data resource. (D) Distribution of PSMA3-interacting proteins from HI.II.14 dataset and IMEx data resource. The PSMA subunits are color-coded. ns (non-significant). *** p ≤ 0.001.
Figure 2
Figure 2
PSMA3 interacts with p21 in the cells. (A) U2OS cells stably expressing PSMA3–FPC. Cell lysates were enriched with proteasomes by ultracentrifugation and loaded on native gel. The membrane was probed with antibody against either HA-tag or the endogenous subunit PSMA4. (B) Schematic description of the antibodies used against the different 26S proteasome subunits for the described co-immunoprecipitation experiments to demonstrate the possible incorporation of a chimeric PSMA3 subunit into proteasomes. The endogenous PSMA1 subunit was first immunoprecipitated and the level of the co-immunoprecipitated subunits was monitored using antibodies to detect the endogenous PSMD1, a subunit of the 19S proteasome, and anti-HA to detect the chimeric PSMA3. (C) The schematic description of the experimental strategy of serial consecutive immunoprecipitation steps. (D) The results obtained from each of the steps described in Panel C. HEK293 cells expressing HA–PSMA3–FPC were harvested 24 h post-transfection. Cells’ lysate was subjected to four subsequent immunoprecipitations of proteasomes via the endogenous PSMA1 subunit. Ten percent of cell lysate was kept for analysis after each immunoprecipitation. (E) Cells were transfected with either PSMA3–FPC or PSMA5–FPC together with p21 FPN (see scheme). We also transfected the cells with H2B–RFP, which provides RFP labeling of the transfected cells’ nuclei. Successful BiFC using fluorescent microscopy, 20× objective 48 h post-transfection. (F) Intensities of at least 10,000 cells for each PSMA–p21 and PSMA–NQO1 combination were recorded by flow cytometry. Standard deviation bars represent two biological replica. (G) Expression level of the proteins in the cells was examined.
Figure 3
Figure 3
The PSMA3 C-terminus is sufficient to interact with p21. (A) Cells were transfected with the PSMA5 and three chimera (see Figure S3) together with p21-VFP and fluorescence intensities of at least 10,000 cells for each case were monitored and recorded by flow cytometry. PSMA5-3short is made of PSMA5 amino acids 1–187 with PSMA3 (187-229 aa) at its c-terminus. PSMA5-3long is as above but the PSMA3 fragment is longer (187–255 aa). Standard deviation bars represent three independent experiments. * p = 0.03, ** p = 0.001 using a two-tailed Student t test. (B) Schematic illustration of the experimental strategy with the antibodies used for immunoprecipitation (IP) or immunoblotting (IB), the latter to detect myc-tagged p21. HEK293 cells were transiently transfected as indicated with 6xmyc p21 and chimeric PSMA5 subunits. Cells were harvested 48 h post-transfection, lysed and subjected to IP with HA beads to immunoprecipitate chimeric PSMA5 subunits. Total lysate and IP samples were analyzed by SDS–PAGE and immunoblotting. (C) Representative SDS–PAGE and immunoblot analysis of the overexpressed proteins that were tested for interaction. Ponceau staining was used as a loading control. * non-specific band (D) The scheme of divided luciferase experiment is shown above the obtained data analyzed by Boxplot representing the overall bioluminescent signals corresponding to interaction between p21 and either PSMA3 or PSM3 187–255. The samples are numbered based on Panel C. n = 14–18. *** p ≤ 0.001, **** p ≤ 0.0001, using a two-tailed Student t test.
Figure 4
Figure 4
Isolated PSMA3 C-terminus interacts with many intrinsically disordered proteins. (A) Illustration of constructs used and experimental strategy. (B) Purified GST, GST PSMA3 trapper and GST PSMA5 C terminus (control) bound to glutathione agarose beads were incubated with HEK293 cell lysate overexpressing 6xmyc p21 or naive HEK293 cell lysate. GST constructs and the interacting proteins were eluted with 10 mM reduced glutathione. GST constructs were visualized with Ponceau and interacting proteins; myc-p21 and endogenous c-Fos and p53 were detected by immunoblot (IB). (C) The different GST-chimeric proteins described in A were incubated with cellular extract. The bound proteins were identified by MS. One hundred fifty-seven proteins were retained on the GST–PSMA3 trapper fragment, whereas only nine were retained on the GST–PSMA5 C terminus fragment. The former group was analyzed for IDP/IDR content. The Boxplot shows the IDP/IDR content of the proteome compared to the trapped proteins by the PSMA3 C-terminal fragment and to the 20S IDPome group. **** p ≤ 0.0001 (D) Venn diagram of the proteins retained on the column containing the GST–PSMA3 trapper fragment and the 20S IDPome. (E) The expected average number of shared proteins between the two groups in Panel D was evaluated by a Z-test with the null distribution calculated by 10,000 simulations. The expected intersection number is approximately 25 proteins, whereas the observed number is 70 (red dot, p-Value < 0.00001). (F) HEK293 IDP-enriched lysate was incubated for three hours at 37 °C with purified 20S proteasome, GST–PSMA3 trapper and GST as indicated. Protocol for 20S purification was previously described [18]. Proteins were visualized with InstantBlue stain. (G) A model describing the steps of IDP recognition by the trapper and degradation by the 20S.
Figure 5
Figure 5
Many of the PSMA3–TBPs share the 20S proteasome substrate hallmarks (AF) Three groups of proteins are compared and labeled -1 for overall proteome, 2 for PSMA3–TBPs and 3 for 20S–IDPome. These groups of proteins were compared for: (A) the average disorder degree (Boxplot); (B) percentage of RBPs in the group; (C) percentage of proteins positive for low complexity region (LCR); (D) percentage of proteins positive for prion-like domain (PrLD); (E) percentage of proteins interacting with GR/PR di-peptide repeats; (F) percentage of proteins with PScore equal to or above 4. (GL) Under this set of panels, the 20S IDPome group of proteins (Group 1: 505 proteins) is compared to a fraction of the PSMA3–BPs that is shared by Group 1 (group 2: 70 proteins) and that is not shared by Group 1 (Group 3: 113 proteins). The comparison was conducted for: (G) the average disorder degree (Boxplot); (H) percentage of RBPs in the group; (I) percentage of proteins positive for low complexity region (LCR); (J) percentage of proteins positive for prion-like domain (PrLD); (K) percentage of proteins positive for GR/PR di-peptide repeats interactor proteins; and (L) percentage of proteins with PScore equal or above 4. NS (non-significant) p > 0.05, * p ≤ 0.05, ** p ≤ 0.01, **** p ≤ 0.0001, using a two-tailed Student t test.
Figure 6
Figure 6
Many of the PSMA3 trapper-binding proteins (TBPs) are proteasomal associated in the cells (A) Venn diagram of the nascent proteasome substrates (nascent peptides, 1192 proteins) and the PSMA3–BPs (trapper). (B) The expected overlap between the two groups in Panel A was evaluated by a Z-test with the null distribution calculated by 10,000 simulations. The expected average overlapped group is 20 proteins, whereas the observed number is 72 (red dot) (p-value < 0.00001). (CG) Under this set of panels, the proteome (Group 1) is compared to the following groups: PSMA3–TBPs (Group 2 n = 183); proteins that are found in Group 2 and also in the nascent substrate proteins (Group 3 n = 72); proteins that are of PSMA3–TPs group but not found in the nascent substrate proteins (Group 4 n = 111). The comparison was conducted for: (C) the average disorder degree (Boxplot); (D) percentage of RBPs in the group; (E) percentage of proteins positive for low complexity region (LCR); (F) percentage of proteins positive for prion-like domain (PrLD); and (G) percentage of proteins positive for GR/PR di-peptide repeats interactor proteins. NS (non-significant) p > 0.05, * p ≤ 0.05, ** p ≤ 0.01, *** p ≤ 0.001, **** p ≤ 0.0001, using a two-tailed Student t test.

References

    1. Ravid T., Hochstrasser M. Diversity of degradation signals in the ubiquitin-proteasome system. Nat. Rev. Mol. Cell Biol. 2008;9:679–690. doi: 10.1038/nrm2468. - DOI - PMC - PubMed
    1. Rousseau A., Bertolotti A. Regulation of proteasome assembly and activity in health and disease. Nat. Rev. Mol. Cell Biol. 2018;19:697–712. doi: 10.1038/s41580-018-0040-z. - DOI - PubMed
    1. Cheng Y. Toward an atomic model of the 26S proteasome. Curr. Opin. Struct. Biol. 2009;19:203–208. doi: 10.1016/j.sbi.2009.02.004. - DOI - PMC - PubMed
    1. Tanaka K. The proteasome: Overview of structure and functions. Proc. Jpn. Acad. Ser. B Phys. Biol. Sci. 2009;85:12–36. doi: 10.2183/pjab.85.12. - DOI - PMC - PubMed
    1. Chen S., Wu J., Lu Y., Ma Y.-B., Lee B.-H., Yu Z., Ouyang Q., Finley D.J., Kirschner M.W., Mao Y. Structural basis for dynamic regulation of the human 26S proteasome. Proc. Natl. Acad. Sci. USA. 2016;113:12991–12996. doi: 10.1073/pnas.1614614113. - DOI - PMC - PubMed

Publication types

MeSH terms

Substances