. 2022 Sep 26;12(10):1294.
doi: 10.3390/brainsci12101294.

Human-in-the-Loop Optimization of Transcranial Electrical Stimulation at the Point of Care: A Computational Perspective

Affiliations

Human-in-the-Loop Optimization of Transcranial Electrical Stimulation at the Point of Care: A Computational Perspective

Yashika Arora et al. Brain Sci. .

Abstract

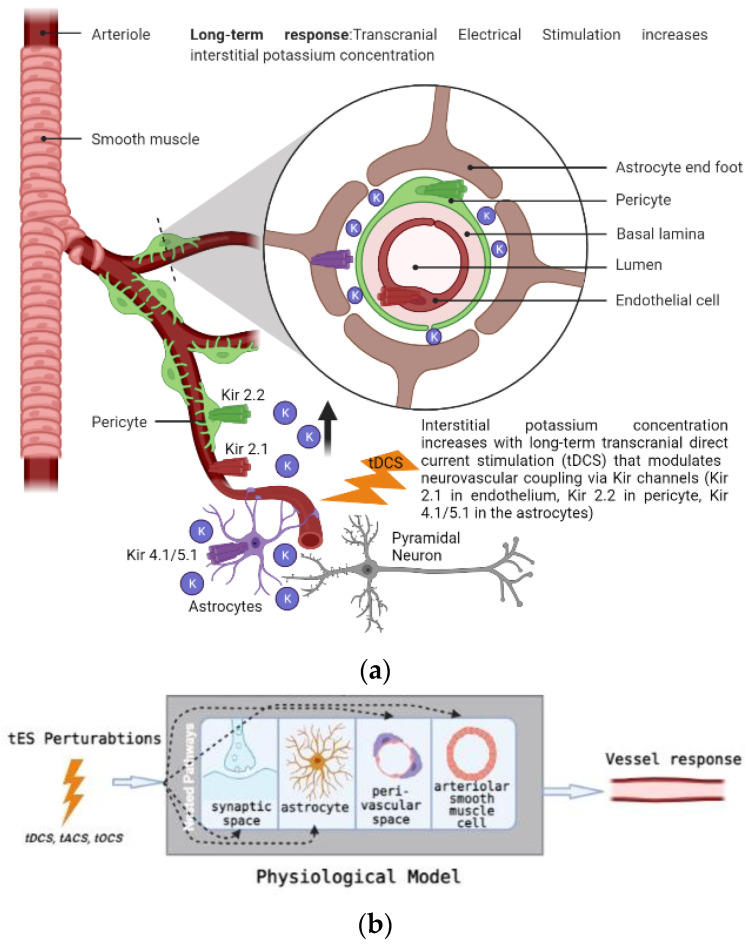
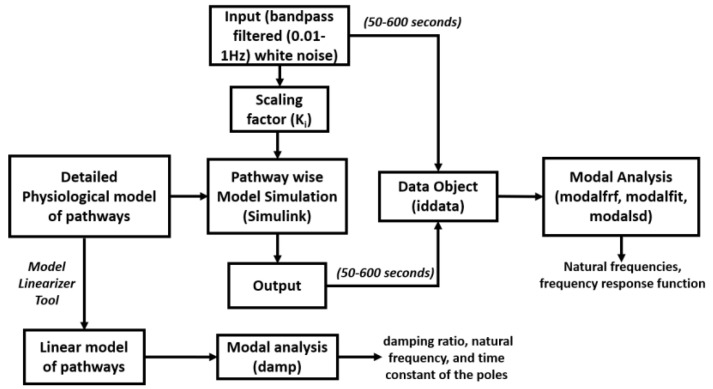
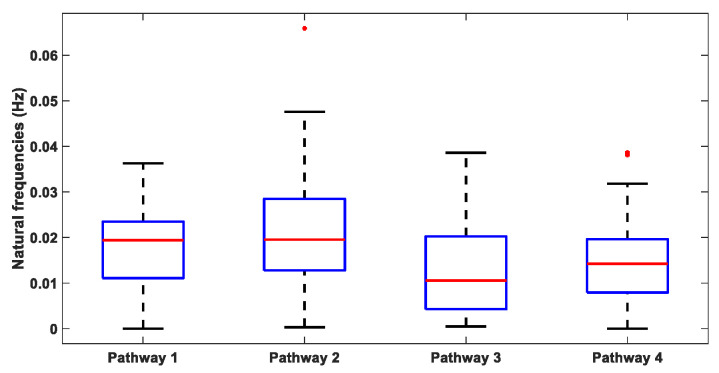
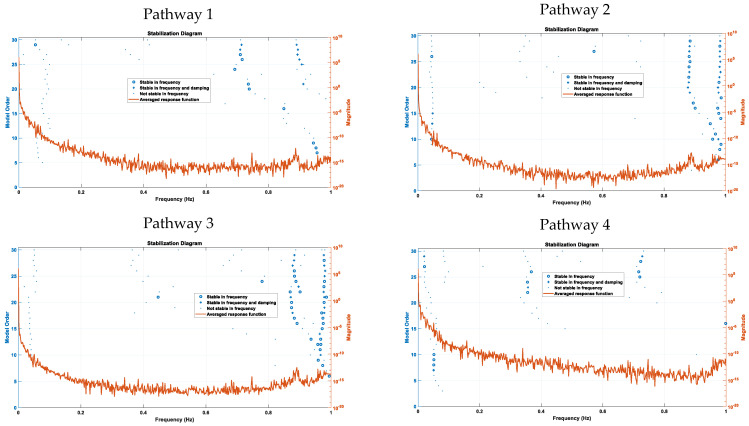
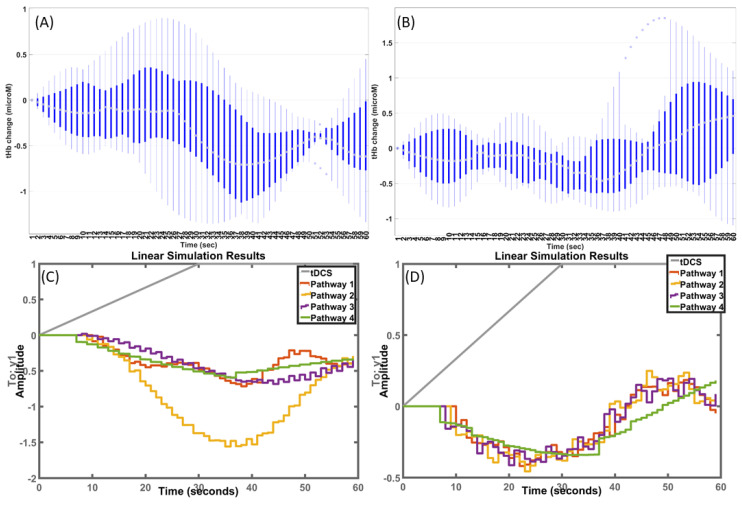
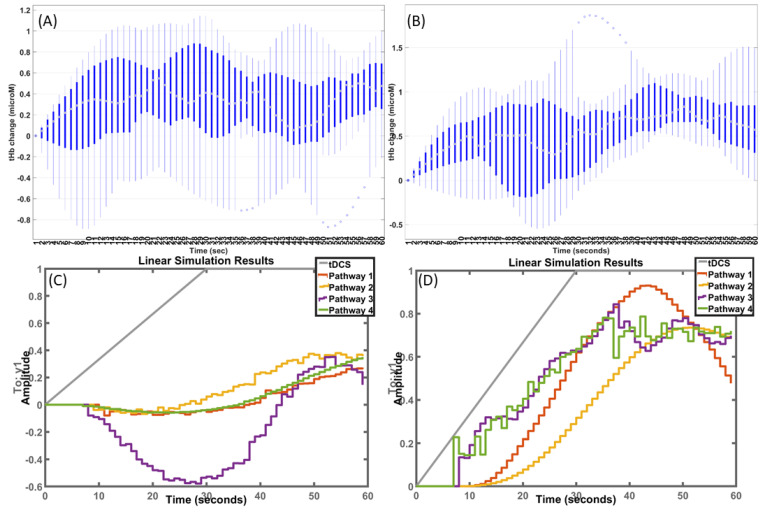
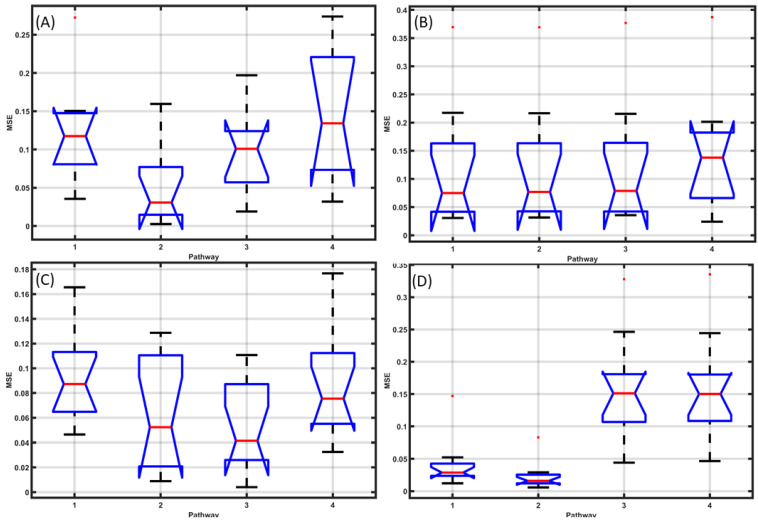
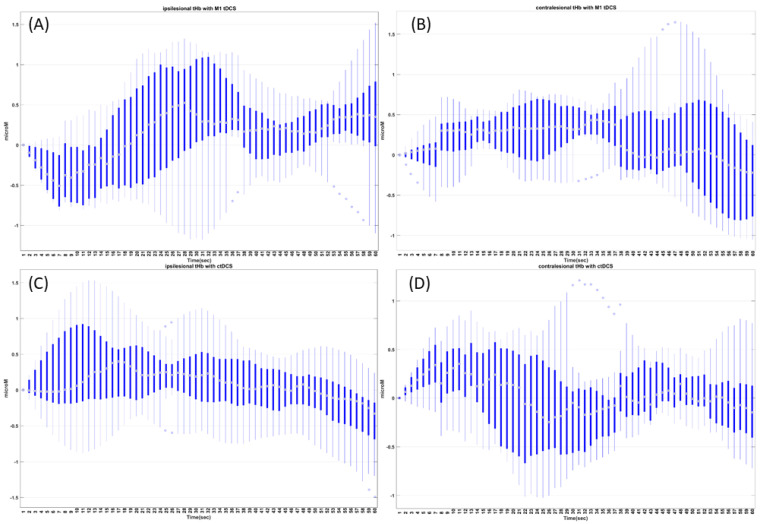
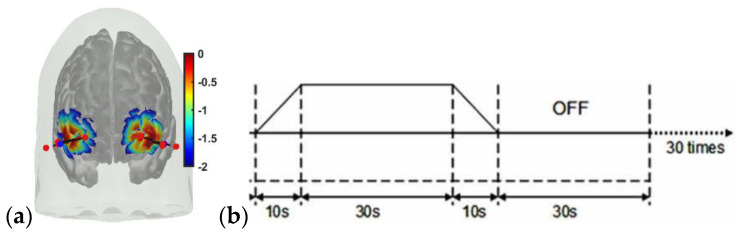
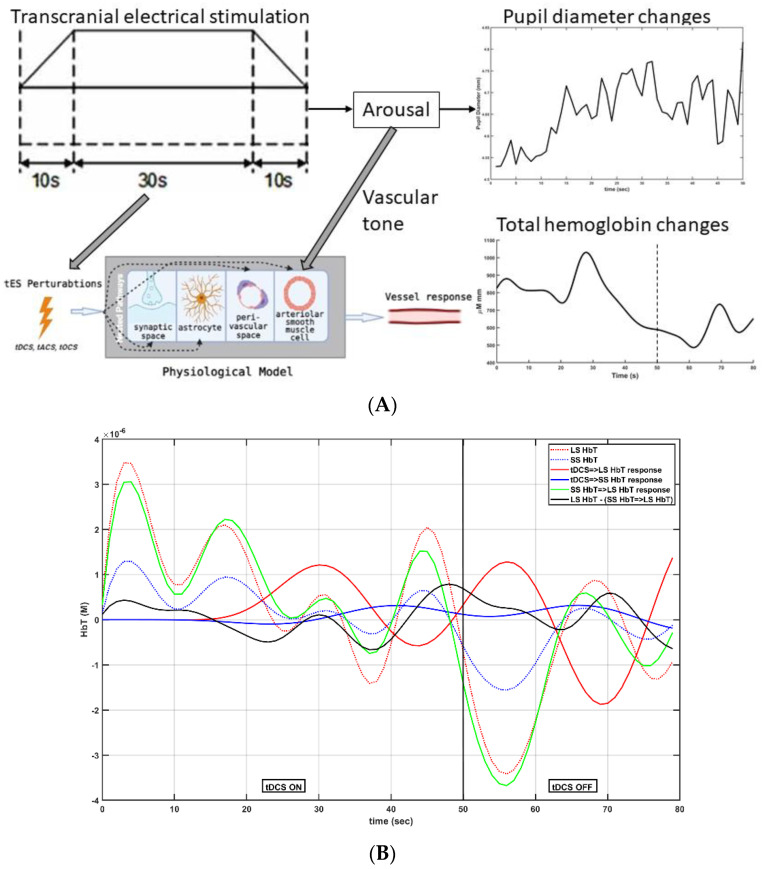
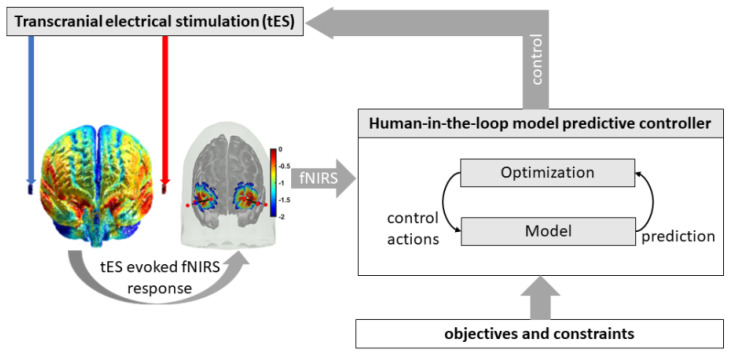
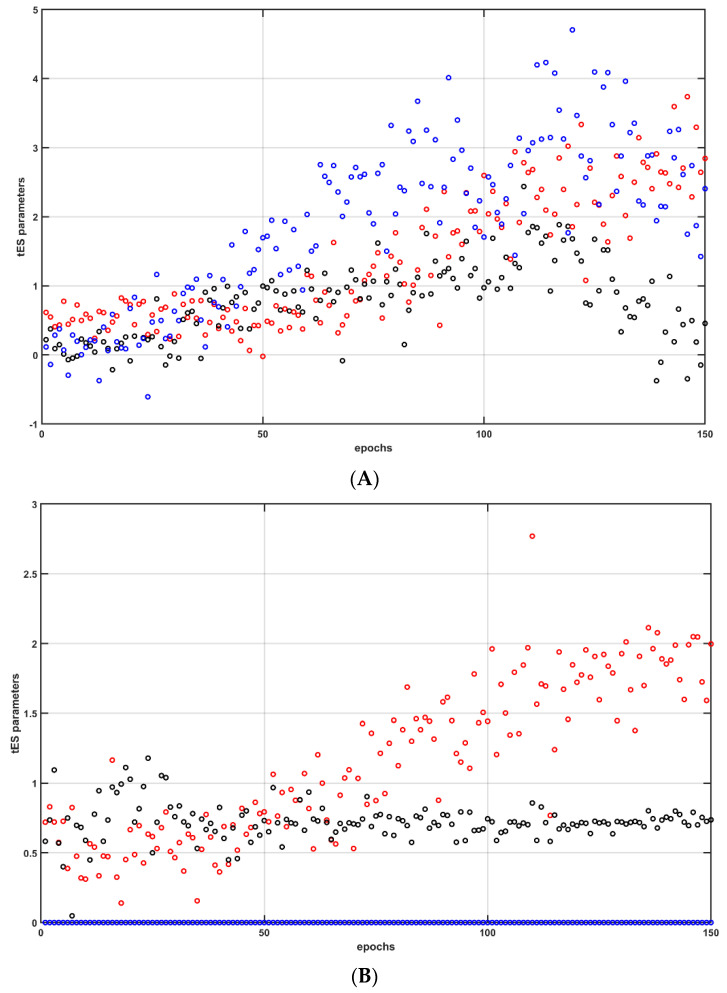
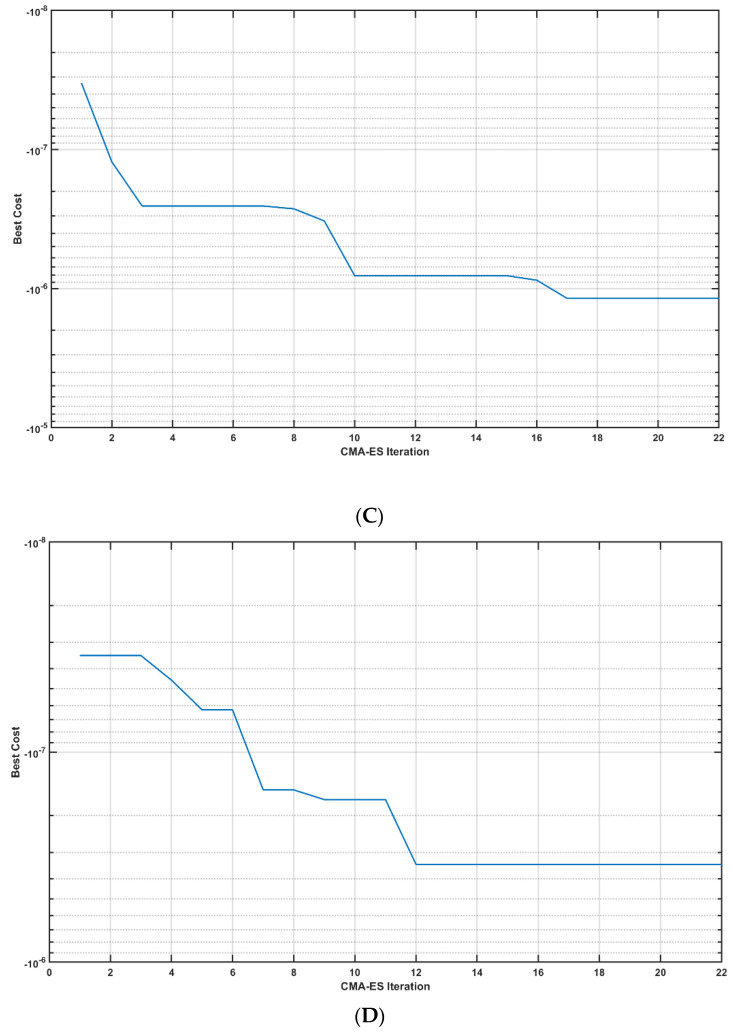
Individual differences in the responsiveness of the brain to transcranial electrical stimulation (tES) are increasingly demonstrated by the large variability in the effects of tES. Anatomically detailed computational brain models have been developed to address this variability; however, static brain models are not “realistic” in accounting for the dynamic state of the brain. Therefore, human-in-the-loop optimization at the point of care is proposed in this perspective article based on systems analysis of the neurovascular effects of tES. First, modal analysis was conducted using a physiologically detailed neurovascular model that found stable modes in the 0 Hz to 0.05 Hz range for the pathway for vessel response through the smooth muscle cells, measured with functional near-infrared spectroscopy (fNIRS). During tES, the transient sensations can have arousal effects on the hemodynamics, so we present a healthy case series for black-box modeling of fNIRS−pupillometry of short-duration tDCS effects. The block exogeneity test rejected the claim that tDCS is not a one-step Granger cause of the fNIRS total hemoglobin changes (HbT) and pupil dilation changes (p < 0.05). Moreover, grey-box modeling using fNIRS of the tDCS effects in chronic stroke showed the HbT response to be significantly different (paired-samples t-test, p < 0.05) between the ipsilesional and contralesional hemispheres for primary motor cortex tDCS and cerebellar tDCS, which was subserved by the smooth muscle cells. Here, our opinion is that various physiological pathways subserving the effects of tES can lead to state−trait variability, which can be challenging for clinical translation. Therefore, we conducted a case study on human-in-the-loop optimization using our reduced-dimensions model and a stochastic, derivative-free covariance matrix adaptation evolution strategy. We conclude from our computational analysis that human-in-the-loop optimization of the effects of tES at the point of care merits investigation in future studies for reducing inter-subject and intra-subject variability in neuromodulation.

Keywords: functional near-infrared spectroscopy; model predictive control; pupillometry; systems analysis; transcranial electrical stimulation.


Conflict of interest statement

Yashika Arora declares that this research was conducted in the absence of any commercial or financial relationships that could be construed as potential conflicts of interest. Anirban Dutta is an inventor of the intellectual property developed by SIAGNOS LLC, USA, where Anirban Dutta holds equity.

Figures

Figure 1
Figure 1
(a) Long-term (≥3 min) transcranial electrical stimulation can change the interstitial concentration of potassium, modulating the neurovascular system’s sensitivity via Kir channels. (b) Four-compartment lumped physiological model of the neurovascular unit with nested pathways (dashed arrows) that can be perturbed by the tES current density, leading to vessel response in terms of diameter changes.
Figure 2
Figure 2
Modal analysis approach used for evaluating the physiological model using MATLAB and Simulink (MathWorks Inc., Natick, MA, USA).
Figure 3
Figure 3
Boxplot of the natural frequencies in the physiological frequency range of 0.01–0.2 Hz obtained through modal analysis for the four tES perturbation model pathways. On each box, the central mark indicates the median, and the bottom and top edges of the box indicate the 25th and 75th percentiles, respectively. The whiskers extend to the most extreme data points not considered outliers, and the outliers are plotted individually using the red “+” symbol.
Figure 4
Figure 4
Stabilization diagrams obtained for the four tES perturbation pathways.
Figure 5
Figure 5
Box-plots of HbT (μM) time series for 0–60 s of M1 tDCS (0–30 s ramp-up and 30–60 s steady-state) are shown at the (A) ipsilesional and (B) contralesional hemispheres. Four pathways fitted to fNIRS HbT time-series data at the (C) ipsilesional and (D) contralesional hemispheres are also shown.
Figure 6
Figure 6
Boxplots of HbT (µM) time series for 0–60 s of ctDCS (0–30 s ramp-up and 30–60 s steady-state) are shown at the (A) ipsilesional and (B) contralesional hemispheres. Four pathways fitted to fNIRS HbT time-series data at the (C) ipsilesional and (D) contralesional hemispheres are also shown.
Figure 7
Figure 7
Mean squared error (MSE) with M1 tDCS for HbT at the (A) ipsilesional and (B) contralesional hemispheres. MSE with ctDCS for HbT at the (C) ipsilesional and (D) contralesional hemispheres.
Figure 8
Figure 8
Boxplots of filtered HbT (µM) time series for 0–60 s of M1 tDCS at the (A) ipsilesional and (B) contralesional hemispheres, and for ctDCS at the (C) ipsilesional and (D) contralesional hemispheres.
Figure 9
Figure 9
(a) Sensitivity profile of the optode montage (red dots are sources at long separation and short separation from detectors; blue dots are detectors). The sensitivity values are displayed logarithmically, with a default range of 0.01 to 1, or −2 to 0 in log10 units; (b) 30 s ON–30 s OFF tDCS paradigm with 10 s ramp-up/10 s ramp-down—repeated 30 times in a block design.
Figure 10
Figure 10
(A) Transcranial electrical stimulation (tES)--evoked arousal leads to changes in the pupil diameter as well as the vascular tone, affecting the evoked hemodynamic response. (B) An illustrative example of HbT responses in long-separation (LS) and short-separation (SS) fNIRS channels. LS HbT: long-separation total hemoglobin changes, SS HbT: short-separation total hemoglobin changes, tDCS => LS HbT response: transfer function response with tDCS waveform input and LS HbT output, tDCS => SS HbT response: transfer function response with tDCS waveform input and SS HbT output, SS HbT => LS HbT response: transfer function response with SS HbT input and LS HbT output, LS HbT--(SS HbT => LS HbT): SS HbT => LS HbT response subtracted from LS HbT.
Figure 11
Figure 11
An illustrative model predictive control scheme.
Figure 12
Figure 12
Human-in-the-loop optimization using a covariance matrix adaptation evolution strategy (CMA--ES): (A) tOCS parameters: DC intensity in mA (blue), AC amplitude in mA (red), and AC frequency in Hz (black). (B) tACS parameters: DC intensity = 0 mA (blue), AC amplitude in mA (red), and AC frequency in Hz (black). (C) Best cost (i.e., negative steady-state gain of HbT in M) for tOCS over 22 iterations of CMA--ES. (D) Best cost (HbT in M) for tACS over 22 iterations of CMA--ES.
Figure 12
Figure 12
Human-in-the-loop optimization using a covariance matrix adaptation evolution strategy (CMA--ES): (A) tOCS parameters: DC intensity in mA (blue), AC amplitude in mA (red), and AC frequency in Hz (black). (B) tACS parameters: DC intensity = 0 mA (blue), AC amplitude in mA (red), and AC frequency in Hz (black). (C) Best cost (i.e., negative steady-state gain of HbT in M) for tOCS over 22 iterations of CMA--ES. (D) Best cost (HbT in M) for tACS over 22 iterations of CMA--ES.

Similar articles

Cited by

References

    1. Vassilieva A., Olsen M.H., Peinkhofer C., Knudsen G.M., Kondziella D. Automated Pupillometry to Detect Command Following in Neurological Patients: A Proof-of-Concept Study. PeerJ. 2019;7:e6929. doi: 10.7717/peerj.6929. - DOI - PMC - PubMed
    1. Olsen M.H., Jensen H.R., Ebdrup S.R., Topp N.H., Strange D.G., Møller K., Kondziella D. Automated Pupillometry and the FOUR Score—What Is the Diagnostic Benefit in Neurointensive Care? Acta Neurochir. 2020;162:1639–1645. doi: 10.1007/s00701-020-04381-y. - DOI - PMC - PubMed
    1. Othman M.H., Bhattacharya M., Møller K., Kjeldsen S., Grand J., Kjaergaard J., Dutta A., Kondziella D. Resting-State NIRS-EEG in Unresponsive Patients with Acute Brain Injury: A Proof-of-Concept Study. Neurocrit. Care. 2020;34:31–44. doi: 10.1007/s12028-020-00971-x. - DOI - PubMed
    1. Chougule P.S., Najjar R.P., Finkelstein M.T., Kandiah N., Milea D. Light-Induced Pupillary Responses in Alzheimer’s Disease. Front. Neurol. 2019;10:360. doi: 10.3389/fneur.2019.00360. - DOI - PMC - PubMed
    1. Chan L., Liao Y.-C., Mo G.B., Dudley J.J., Cheng C.-L., Kristensson P.O., Oulasvirta A. Investigating Positive and Negative Qualities of Human-in-the-Loop Optimization for Designing Interaction Techniques; Proceedings of the 2022 CHI Conference on Human Factors in Computing Systems; New Orleans, LA, USA. 30 April–5 May 2022; New York, NY, USA: Association for Computing Machinery; 2022. pp. 1–14.

LinkOut - more resources