Review
. 2022 Sep 25;12(10):1369.
doi: 10.3390/biom12101369.

Integration of Nanometer-Range Label-to-Label Distances and Their Distributions into Modelling Approaches

Affiliations
Review

Integration of Nanometer-Range Label-to-Label Distances and Their Distributions into Modelling Approaches

Gunnar Jeschke. Biomolecules. .

Abstract

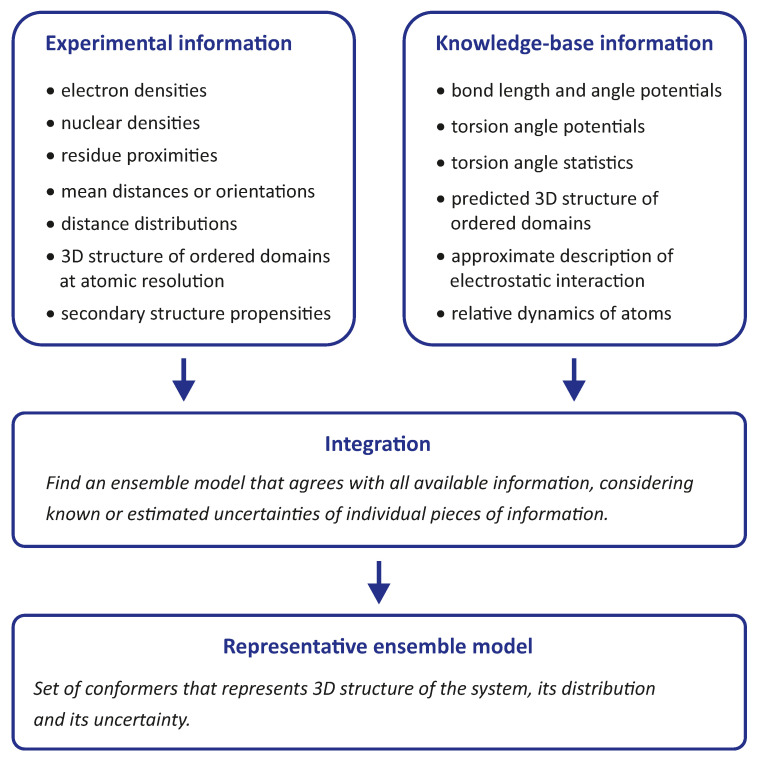
Labelling techniques such as electron paramagnetic resonance spectroscopy and single-molecule fluorescence resonance energy transfer, allow access to distances in the range of tens of angstroms, corresponding to the size of proteins and small to medium-sized protein complexes. Such measurements do not require long-range ordering and are therefore applicable to systems with partial disorder. Data from spin-label-based measurements can be processed into distance distributions that provide information about the extent of such disorder. Using such information in modelling presents several challenges, including a small number of restraints, the influence of the label itself on the measured distance and distribution width, and balancing the fitting quality of the long-range restraints with the fitting quality of other restraint subsets. Starting with general considerations about integrative and hybrid structural modelling, this review provides an overview of recent approaches to these problems and identifies where further progress is needed.

Keywords: EPR spectroscopy; FRET; double electron electron resonance; ensemble model; intrinsic disorder; molecular force fields; site-directed spin labelling; structural biology.


Conflict of interest statement

The authors declares no conflict of interest.

Figures

Figure 1
Figure 1
General pipeline for integrative and hybrid ensemble modelling. Thick black arrows denote required inputs, thin grey arrows denote optional inputs. The pipeline is preceded by the design and execution of experiments and is complemented by ensemble analysis. Numbers 1 to 5 denote the main modules that can be implemented using different approaches.
Figure 2
Figure 2
Classification of energy landscapes of biomolecular systems. Energy landscapes are associated with uncertainties (semitransparent bands), as explained in the text. (a) Anfinsen limit with a single minimum several times the thermal energy kBT lower than the rest of the hypersurface. Shown are the slightly different energy landscapes corresponding to the system in the living cell (black), two different experimental series 1 (red) and 2 (orange-red), and a molecular force field (blue). (b) System with two separate minima differing by only a small multiple of kBT. (c) Energy landscape, with ruggedness on the order of kBT. (d) Energy landscape that is nearly flat on the order of kBT.
Figure 3
Figure 3
Equivalence between distance distributions (a,c) and potentials of mean force (b,d) for protein site pairs 71/475 (a,b) and 235/475 (c,d) in the complex of polypyrimidine tract binding protein 1 with encephalomyocarditis virus internal ribosome entry site. Data from [31].
Figure 4
Figure 4
Characterisation of conformer distribution by labelling approaches. Shown is an ensemble model for the RNA-binding protein hnRNP A1 in its free, dispersed form (model determined with DEER and SAXS restraints from [21]). The ensemble was reduced to 46 conformers for clarity of display. Conformers are superimposed on the two RNA-binding domains (residues 1–186). The glycine-rich N-terminal domain (residues 187–320) is largely, but not completely disordered. A spin label at site 144 in the ordered domain (green) is narrowly distributed in space. A spin label at site 252 in the disordered domain (orangered) is broadly distributed in space. Computation of spin label positions by a rotamer library and visualization were performed by MMM.
Figure 5
Figure 5
Integration of experimental information and information from knowledge bases into a hybrid ensemble model. The lists of information types for specifying ensembles are examples rather than being exhaustive. The balancing of potentially inconsistent information in the integration step is complicated by partially unknown uncertainty of pieces of information. Construction of a representative ensemble model is complicated by the requirement of separation of uncertainty from natural distribution of 3D structure.
Figure 6
Figure 6
Representation of labels in modelling approaches (a) Rotamer library representation (MMM). Rotamer population is encoded by transparency and by the volume of the purple spheres that represent the N-O group midpoint of rotamers. (b) Accessible volume model parametrized by a linker length Llink, a linker width wlink, and a set of three dye radii Rdye(i). Adapted from [57] (c) Coarse-grained rotamer model based on a dummy ON particle, which represents the midpoint of the N-O group. Each rotamer is defined by a distance r from the Cα atom and two angles that relate the label position to the Cα-Cβ bond. Adapted from [62].
Figure 7
Figure 7
Different representations of a distance distribution in modelling. Data corresponds to spin-labelled site pair 202/475 in the complex of polypyrimidine tract binding protein 1 with encephalomyocarditis virus internal ribosome entry site [31]. Transformations between representations can be well-posed (stable) or ill-posed (potentially unstable) and may require different computational effort. (a) Primary DEER EPR data (black), intermolecular background (green), and fit by a distance distribution (red). (b) Model-free distance distribution (blue) with 95% confidence interval (pale blue). (c) Form factor that results from separation of the label-pair contribution from intermolecular background. The form factor is fully determined by the distance distribution. A fit to primary data involves optimisation of background parameters. (d) Gaussian distribution, which is fully determined by a mean value r and standard deviation σr (blue). Grey vertical lines denote twice the full width at half maximum. Purple vertical lines denote three equidistant distance samples used for exhaustive discrete sampling.
Figure 8
Figure 8
Effect of distance distribution restraints in ensemble reweighting. Shown are the raw ensemble (a) consisting of 1119 conformers for the RNA-binding protein hnRNP A1 in its free, dispersed form ([18]) and the reweighted ensemble (b) of 138 conformers from integrating information from 19 DEER distance distribution restraints and a SAXS curve ([21]). Visualization was performed by ChimeraX.

References

    1. Haber E., Anfinsen C.B. Side-chain Interactions Governing the Pairing of Half-cystine Residues in Ribonuclease. J. Biol. Chem. 1962;237:1839–1844. doi: 10.1016/S0021-9258(19)73945-3. - DOI - PubMed
    1. Wright P.E., Dyson H. Intrinsically unstructured proteins: Re-assessing the protein structure-function paradigm. J. Mol. Biol. 1999;293:321–331. doi: 10.1006/jmbi.1999.3110. - DOI - PubMed
    1. Uversky V.N., Gillespie J.R., Fink A.L. Why are “natively unfolded” proteins unstructured under physiologic conditions? Proteins Struct. Funct. Bioinform. 2000;41:415–427. doi: 10.1002/1097-0134(20001115)41:3<415::AID-PROT130>3.0.CO;2-7. - DOI - PubMed
    1. Dunker A., Lawson J., Brown C.J., Williams R.M., Romero P., Oh J.S., Oldfield C.J., Campen A.M., Ratliff C.M., Hipps K.W., et al. Intrinsically disordered protein. J. Mol. Graph. Model. 2001;19:26–59. doi: 10.1016/S1093-3263(00)00138-8. - DOI - PubMed
    1. Tompa P. Intrinsically unstructured proteins. Trends Biochem. Sci. 2002;27:527–533. doi: 10.1016/S0968-0004(02)02169-2. - DOI - PubMed

Publication types

MeSH terms

LinkOut - more resources