. 2022 Oct 6;12(10):1431.
doi: 10.3390/biom12101431.

Nusinersen Induces Disease-Severity-Specific Neurometabolic Effects in Spinal Muscular Atrophy

Affiliations

Nusinersen Induces Disease-Severity-Specific Neurometabolic Effects in Spinal Muscular Atrophy

Francesco Errico et al. Biomolecules. .

Abstract

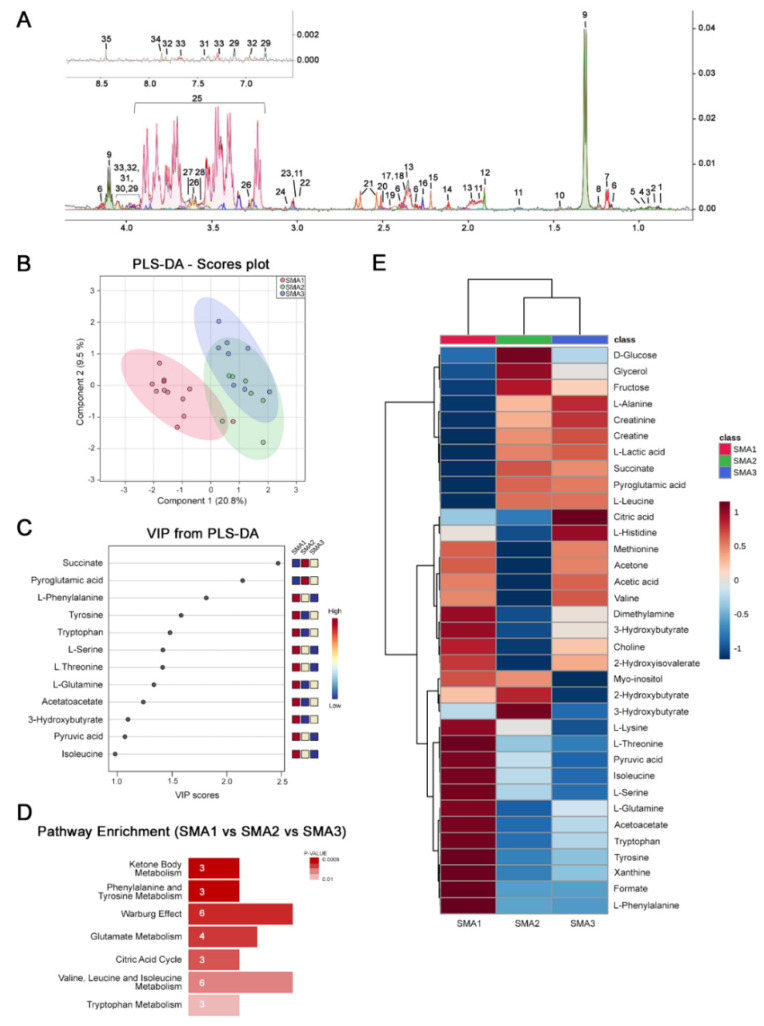
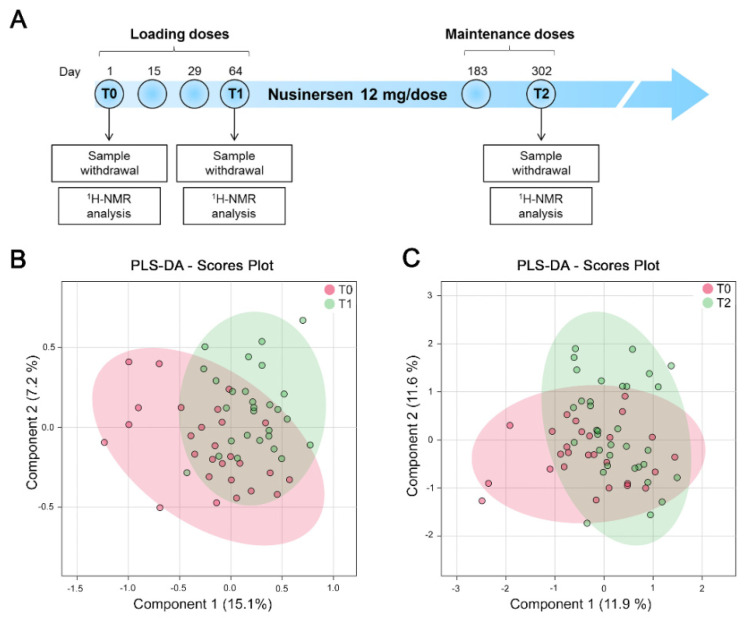
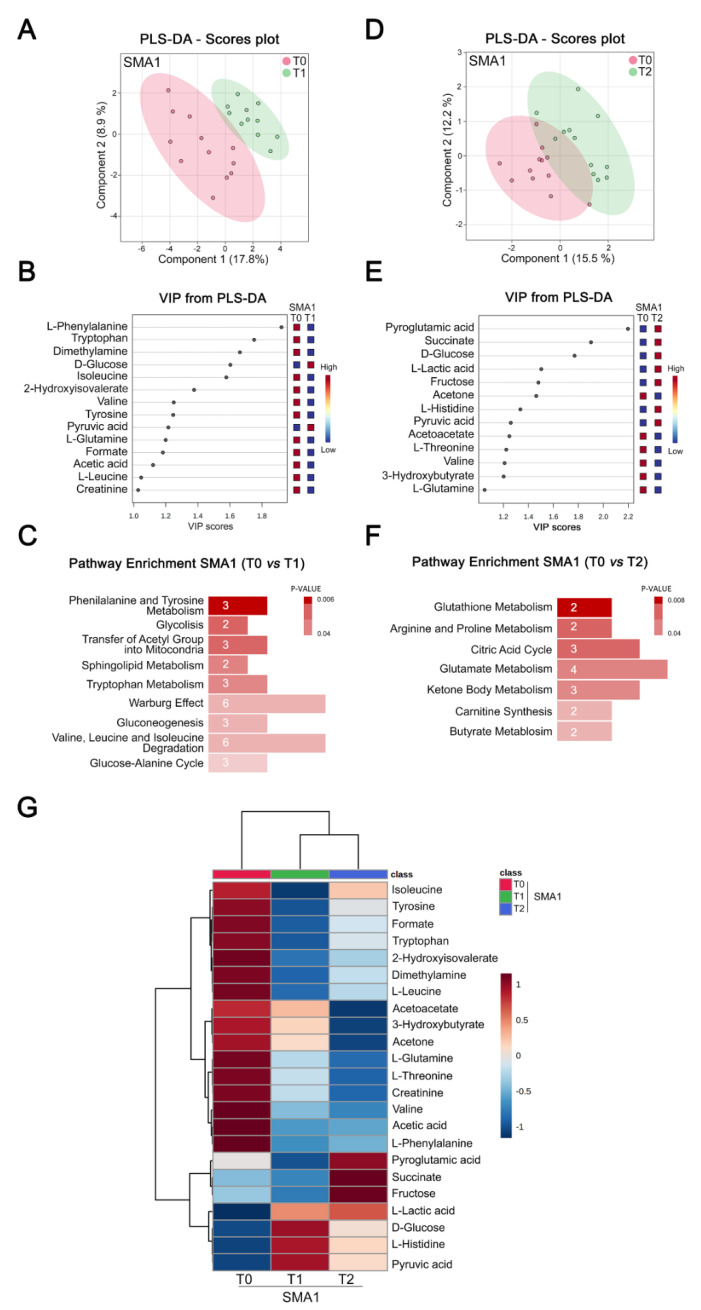
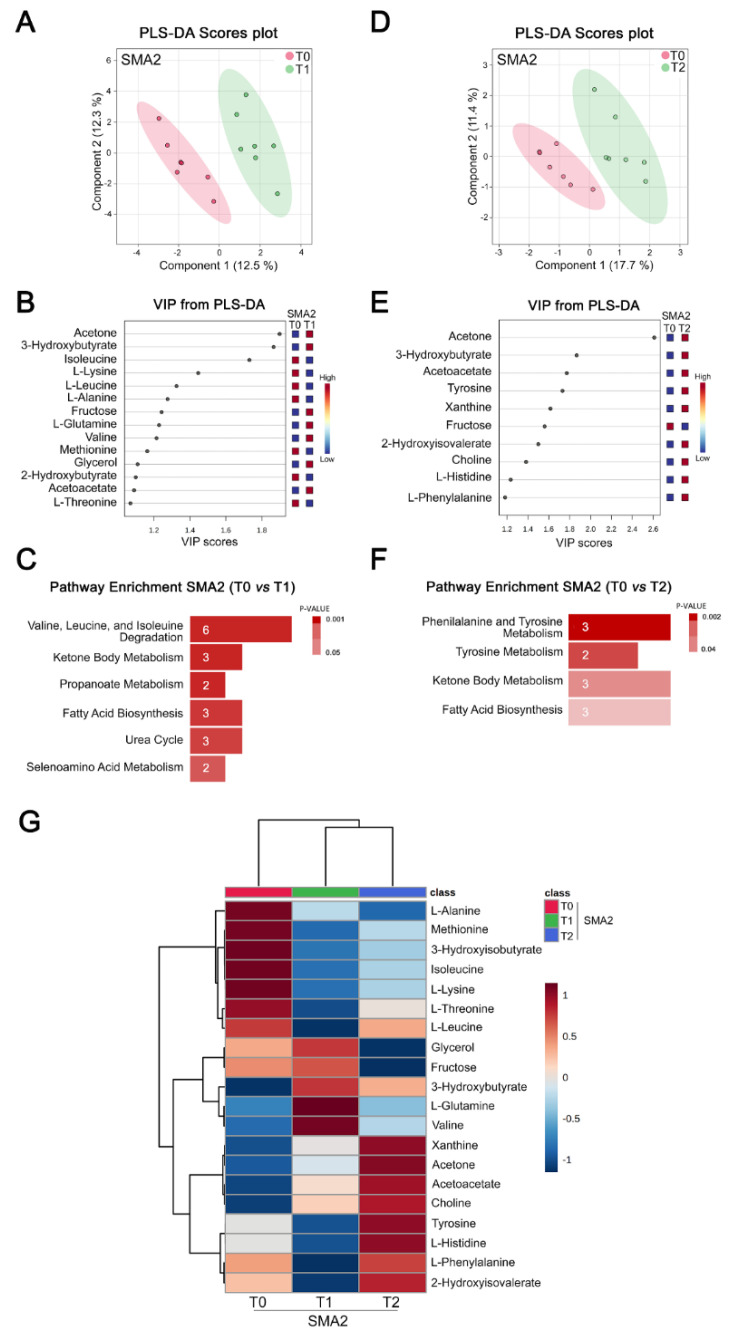
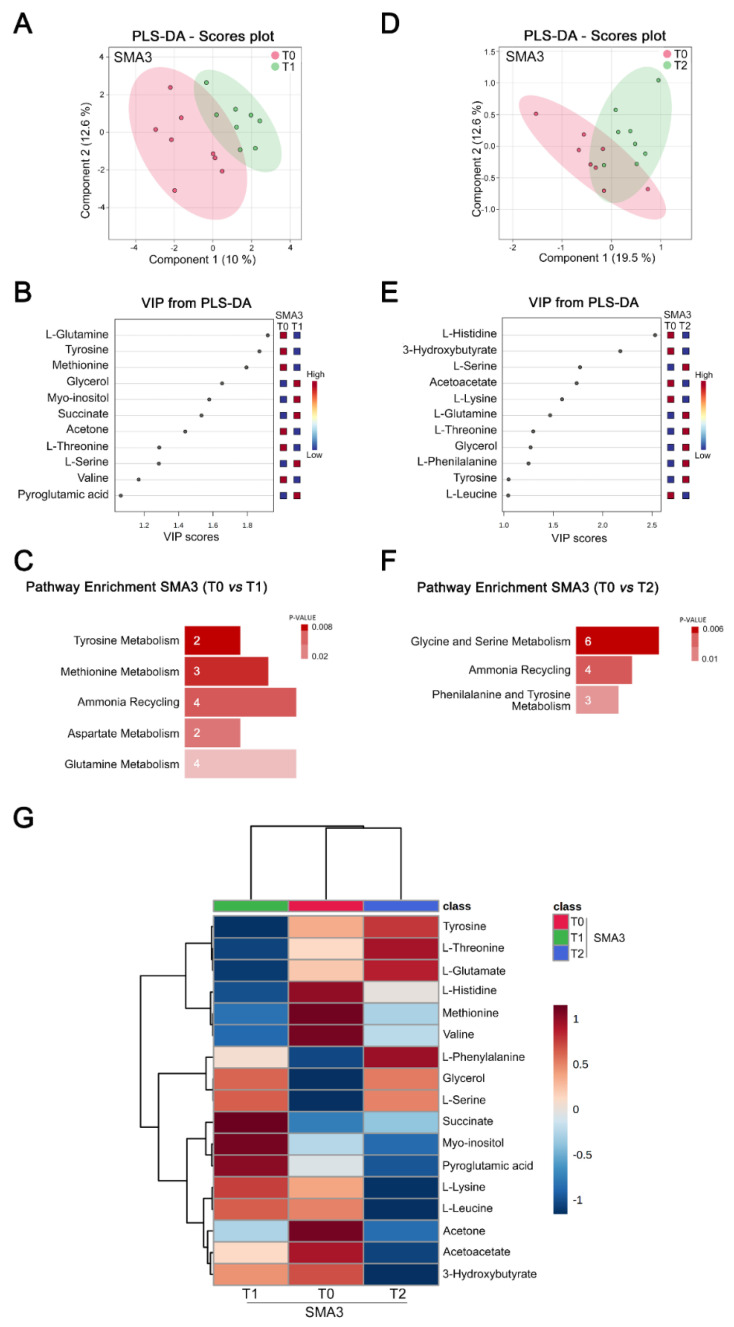
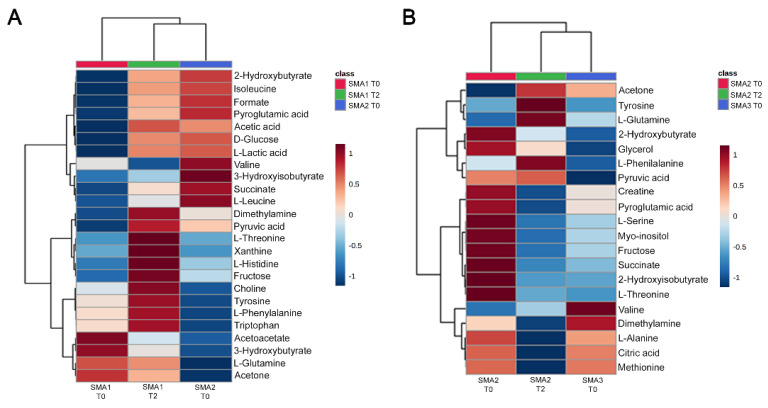
Intrathecal delivery of Nusinersen-an antisense oligonucleotide that promotes survival motor neuron (SMN) protein induction-is an approved therapy for spinal muscular atrophy (SMA). Here, we employed nuclear magnetic resonance (NMR) spectroscopy to longitudinally characterize the unknown metabolic effects of Nusinersen in the cerebrospinal fluid (CSF) of SMA patients across disease severity. Modulation of amino acid metabolism is a common denominator of biochemical changes induced by Nusinersen, with distinct downstream metabolic effects according to disease severity. In severe SMA1 patients, Nusinersen stimulates energy-related glucose metabolism. In intermediate SMA2 patients, Nusinersen effects are also related to energy homeostasis but involve ketone body and fatty acid biosynthesis. In milder SMA3 patients, Nusinersen mainly modulates amino acid metabolism. Moreover, Nusinersen modifies the CSF metabolome of a more severe clinical group towards the profile of untreated SMA patients with milder disease. These findings reveal disease severity-specific neurometabolic signatures of Nusinersen treatment, suggesting a selective modulation of peripheral organ metabolism by this CNS-directed therapy in severe SMA patients.

Keywords: cerebrospinal fluid (CSF); nuclear magnetic resonance (NMR); nusinersen; spinal muscular atrophy (SMA); survival motor neuron (SMN).


Conflict of interest statement

C.B. received advisory board honoraria from Avexis, Biogen, Novartis, and Roche. The other authors declare that no conflict of interest exist.

Figures

Figure 1
Figure 1
Metabolomic profile of CSF from naive SMA1, SMA2, and SMA3 patients. (A) Representative 1D 1H CPMG NMR spectrum obtained from the CSF of one SMA1 patient. CSF polar extracts of SMA patients detected the presence of 35 metabolites (1: 2-Hydroxybutyric acid; 2: 2-Hydroxyisovalerate; 3: L-leucine; 4: L-isoleucine; 5: L-valine; 6: 3-Hydroxybutyric acid; 7: 3-Hydroxyisobutyrate; 8: L-threonine; 9: lactic acid; 10: L-alanine; 11: L-lysine; 12: acetic acid; 13: L-glutamine; 14: L-methionine; 15: acetone; 16: acetoacetate; 17: pyroglutamic acid; 18: succinic acid; 19: pyruvic acid; 20: dimethylamine; 21: citric acid; 22: creatine; 23: creatinine; 24: choline; 25: D-glucose; 26: myo-inositol; 27: fructose; 28: glycerol; 29: L-tyrosine; 30: L-serine; 31: L-phenylalanine; 32: L-histidine; 33: L-tryptophan; 34: xantine; 35: formic acid). (B) PLS-DA score scatter plots showing the metabolomic profile of CSF from SMA1, SMA 2, and SMA3 patients prior to treatment. The cluster analyses are reported in the Cartesian space, which is described by the main components, PC1: 20.8% and PC2: 9.5%. PLS-DA was evaluated using cross-validation (CV) analysis. CV tests performed according to PLS-DA statistical protocol show a significant separation between SMA1, SMA2, and SMA3 at T0 (0.44 and 0.69 accuracy values on PC1 and PC2, respectively, and positive 0.31 and 0.437 Q2 indexes). (C) VIP score graphs of the metabolites discriminating the CSF of SMA1, SMA2, and SMA3 patients at T0. Metabolites characterized by a VIP score > 1 are shown. (D) Diagram of the pathway enrichment analysis showing the most dysregulated pathways at baseline. The number of molecules (hits) related to the specific metabolic pathway is shown within each bar. (E) Hierarchical heat maps generated by MetaboAnalyst software are based on the Euclidean distance and Ward’s algorithm. The bar color represents each metabolite’s abundance on a normalized scale from blue (low level) to red (high level). The dendrogram at the top is based on the similarity of the metabolomic profile relative to each sample cluster. The dendrogram on the left is based on the metabolite abundance profiles.
Figure 2
Figure 2
NMR analysis does not identify Nusinersen-dependent neurometabolomic effects in the CSF of a pooled cohort of SMA patients with different disease severity. (A) Schematic representation of the timeline of Nusinersen administration and CSF collection in SMA patients. (B,C) Multivariate statistical analysis performed on the cluster concentration matrices of the whole cohort of SMA1-3 patients collected before Nusinersen administration (T0) and at loading (T1) or maintenance phase (T2) using MetaboAnalyst 5.0. Multivariate statistical analysis produced PLS-DA score scatter plots relative to the CSF composition from SMA patients at T0 and T1 (B) as well as at T0 and T2 (C). This analysis revealed the absence of significant metabolomic differences in the CSF of the whole cohort of SMA patients either at T1 or T2, relative to untreated patients at T0. PLS-DA was evaluated using cross validation (CV) analysis. The clusters analyses are reported in the Cartesian space that is described by the main components, PC1: 15.1% and PC2: 7.2% (T0 vs. T1 clusters) (B) and PC1: 11.9% and PC2: 11.6% (T0 vs. T2 clusters) (C). CV reported Q2 negative values of −0.02 and −0.31 for the first and second principal component of SMA patients at T0 and T1, respectively; and of −0.44 and −0.84 for SMA patients at T0 and T2, respectively (see also Table S2).
Figure 3
Figure 3
Nusinersen modulates amino acid and glucose metabolism in the CSF of SMA1 patients. (A,D) PLS-DA score scatter plots showing the metabolomic profiles of CSF for SMA1 patients prior to treatment (T0) and at loading (T1) (A) or maintenance (T2) phases (D) of Nusinersen administration. PLS-DA was evaluated using cross validation (CV) analysis. The clusters analyses are reported in the Cartesian space that is described by the main components, PC1: 17.8% and PC2: 8.9% (T0 vs. T1 clusters, respectively) (A), and PC1: 15.5% and PC2: 12.2% (T0 vs. T2 clusters, respectively) (D). CV tests performed according to PLS-DA statistical protocol show a significant separation between T0 and T1 clusters (0.68 and 0.77 accuracy values for PC1 and PC2, respectively, and positive 0.14 and 0.43 Q2 indices) (A), and T0 and T2 clusters (0.70 and 0.67 accuracy values for PC1 and PC2, respectively, and positive 0.02 and 0.03 Q2 indices) (D). The data reveal that Nusinersen induces metabolic changes in the CSF of SMA1 patients at both loading and maintenance phases. (B,E) VIP score graphs of the metabolites discriminating the CSF of SMA1 patients at T0 from those of the same patients at T1 (B) or T2 (E). Metabolites characterized by a VIP score > 1 are shown. (C,F) Diagram of the pathway enrichment analysis showing the effect of Nusinersen therapy on several biochemical pathways associated with amino acid and glucose metabolism in SMA1 patients at both T1 (C) and T2 (F). The number of molecules (hits) related to the specific metabolic pathway is shown within each bar (see also Table S4). (G) Hierarchical heat maps generated by MetaboAnalyst software are based on the Euclidean distance and Ward’s algorithm. The heatmaps are calculated based on the concentrations of discriminating metabolites with VIP > 1 in the CSF of SMA1 patients at T0, T1, and T2. For each metabolite, the bar color represents its abundance on a normalized scale from blue (low level) to red (high level). The dendrogram at the top is based on the similarity of the metabolomic profile relative to each sample cluster. The dendrogram on the left is based on the metabolite abundance profiles. This analysis highlights hierarchical separation of CSF metabolomic profiles at loading (T1) and maintenance (T2) phases from the baseline (T0). This confirms that Nusinersen administration induces changes in the metabolomic CSF profile of SMA1 patients.
Figure 4
Figure 4
Nusinersen modulates amino acid and ketone body metabolism in the CSF of SMA2 patients. (A,D) PLS-DA score scatter plots showing the metabolomic profile of CSF from SMA2 patients before treatment (T0) and at loading (T1) (A) or maintenance (T2) (D) phases of Nusinersen administration. The clusters’ analyses are reported in the Cartesian space that is described by the main components, PC1: 12.5% and PC2: 12.3% (T0 vs. T1 clusters) (A) and PC1: 17.7% and PC2: 11.4% (T0 vs. T2 clusters) (D). PLS-DA was evaluated using cross validation (CV) analysis. CV tests performed according to PLS-DA statistical protocol show a significant separation between T0 and T1 clusters (0.94 and 1.0 accuracy values for PC1 and PC2, respectively, with positive 0.58 and 0.83 Q2 indices) (A), and T0 and T2 clusters (0.57 and 0.71 accuracy values for PC1 and PC2, respectively, and 0.23 and 0.29 Q2 indices) (D). The data reveal that Nusinersen induces metabolic changes in the CSF of SMA2 patients at both loading and maintenance phases. (B,E) VIP score graphs of metabolites discriminating the CSF of SMA2 patients at T0 from that of the same patients at T1 (B) or T2 (E). Metabolites characterized by a VIP score > 1 are shown. (C,F) Diagram of the pathway enrichment analysis showing the effect of Nusinersen therapy on biochemical pathways associated with amino acid and ketone body metabolism in SMA2 patients at both T1 (C) and T2 (F). The number of molecules (hits) related to the specific metabolic pathway is shown within each bar (see also Table S4). (G) Hierarchical heat maps generated by MetaboAnalyst software are based on the Euclidean distance and Ward’s algorithm. The heatmaps are calculated based on the concentrations of discriminating metabolites with VIP > 1 in the CSF of SMA2 patients at T0, T1, and T2. For each metabolite, the bar color represents its abundance on a normalized scale from blue (low level) to red (high level). The dendrogram at the top is based on the similarity of the metabolomic profile relative to each sample cluster. The dendrogram on the left is based on the metabolite abundance profiles. The analysis highlights hierarchical separation of CSF metabolomic profiles at loading (T1) and maintenance (T2) phases from the baseline (T0). This confirms that Nusinersen administration induces changes in the metabolomic CSF profile of SMA2 patients.
Figure 5
Figure 5
Nusinersen modulates amino acid metabolism in the CSF of SMA3 patients. (A,D) PLS-DA score scatter plots showing the metabolomic profile of CSF from SMA3 patients prior to treatment (T0) and at loading (T1) (A) or maintenance (T2) (D) phases of Nusinersen administration. The clusters analyses are reported in the Cartesian space that is described by the main components PC1: 10.0% and PC2: 12.6% (T0 vs. T1 clusters, respectively) (A) and PC1: 19.5% and PC2: 12.6% (T0 vs. T2 clusters, respectively) (D). PLS-DA was evaluated using cross validation (CV) analysis. CV tests performed according to PLS-DA statistical protocol show a significant separation between T0 and T1 clusters (0.68 and 0.77 accuracy values for PC1 and PC2, respectively, and positive 0.14 and 0.43 Q2 indexes) (A), and T0 and T2 clusters (0.74 and 0.76 accuracy values for PC1 and PC2, respectively, and positive 0.16 and 0.18 Q2 values) (D). The data reveal that Nusinersen induces metabolic changes in the CSF of SMA3 patients at both loading and maintenance phases. (B,E) VIP score graphs of the metabolites discriminating the CSF of SMA3 patients at T0 from that of the same patients at T1 (B) or T2 (E). Metabolites characterized by a VIP score > 1 are shown. (C,F) Diagram of the pathway enrichment analysis showing a selective effect of Nusinersen therapy on biochemical pathways associated with amino acid metabolism in SMA3 patients at both T1 (C) and T2 (F). The number of molecules (hits) related to the specific metabolic pathway is shown within each bar (see also Table S4). (G) Hierarchical heat maps generated by MetaboAnalyst software are based on the Euclidean distance and Ward’s algorithm. The heatmaps are calculated based on the concentrations of discriminating metabolites with VIP > 1 in the CSF of SMA3 patients at T0, T1, and T2. For each metabolite, the bar color represents its abundance on a normalized scale from blue (low level) to red (high level). The dendrogram at the top is based on the similarity of the metabolomic profile relative to each sample cluster. The dendrogram on the left is based on the metabolite abundance profiles.
Figure 6
Figure 6
Comparative analysis of Nusinersen-dependent neurometabolic changes and disease severity. (A,B) Hierarchical clustering of metabolites identified by NMR analysis from the CSF of SMA1 (T0 and T2) and SMA2 (T0) patients (A) or SMA2 (T0 and T2) and SMA3 (T0) patients (B) shows that the metabolomic changes in treated SMA1 and SMA2 patients resemble the profile of untreated patients with a milder form of the disease. The heatmaps generated by MetaboAnalyst software are based on the Euclidean distance and Ward’s algorithm and are calculated based on the concentrations of discriminating metabolites with VIP > 1. For each metabolite, the bar color represents its abundance on a normalized scale from blue (low level) to red (high level). The dendrogram at the top is based on the similarity of the metabolomic profile relative to each sample cluster. The dendrogram on the left is based on the metabolite abundance profiles.

Similar articles

Cited by

References

    1. Tisdale S., Pellizzoni L. Disease mechanisms and therapeutic approaches in spinal muscular atrophy. J. Neurosci. Off. J. Soci. Neurosci. 2015;35:8691–8700. doi: 10.1523/JNEUROSCI.0417-15.2015. - DOI - PMC - PubMed
    1. Wirth B., Karakaya M., Kye M.J., Mendoza-Ferreira N. Twenty-Five Years of Spinal Muscular Atrophy Research: From Phenotype to Genotype to Therapy, and What Comes Next. Annu. Rev. Genom. Hum. Genet. 2020;21:231–261. doi: 10.1146/annurev-genom-102319-103602. - DOI - PubMed
    1. D’Amico A., Mercuri E., Tiziano F.D., Bertini E. Spinal muscular atrophy. Orphanet J. Rare Dis. 2011;6:71. doi: 10.1186/1750-1172-6-71. - DOI - PMC - PubMed
    1. Hua Y., Sahashi K., Rigo F., Hung G., Horev G., Bennett C.F., Krainer A.R. Peripheral SMN restoration is essential for long-term rescue of a severe spinal muscular atrophy mouse model. Nature. 2011;478:123–126. doi: 10.1038/nature10485. - DOI - PMC - PubMed
    1. Naryshkin N.A., Weetall M., Dakka A., Narasimhan J., Zhao X., Feng Z., Ling K.K., Karp G.M., Qi H., Woll M.G., et al. Motor neuron disease. SMN2 splicing modifiers improve motor function and longevity in mice with spinal muscular atrophy. Science. 2014;345:688–693. doi: 10.1126/science.1250127. - DOI - PubMed

Publication types