. 2022 Oct 6;12(10):1432.
doi: 10.3390/biom12101432.

Structural-Functional Relationship of the Ribonucleolytic Activity of aIF5A from Sulfolobus solfataricus

Affiliations

Structural-Functional Relationship of the Ribonucleolytic Activity of aIF5A from Sulfolobus solfataricus

Alice Romagnoli et al. Biomolecules. .

Abstract

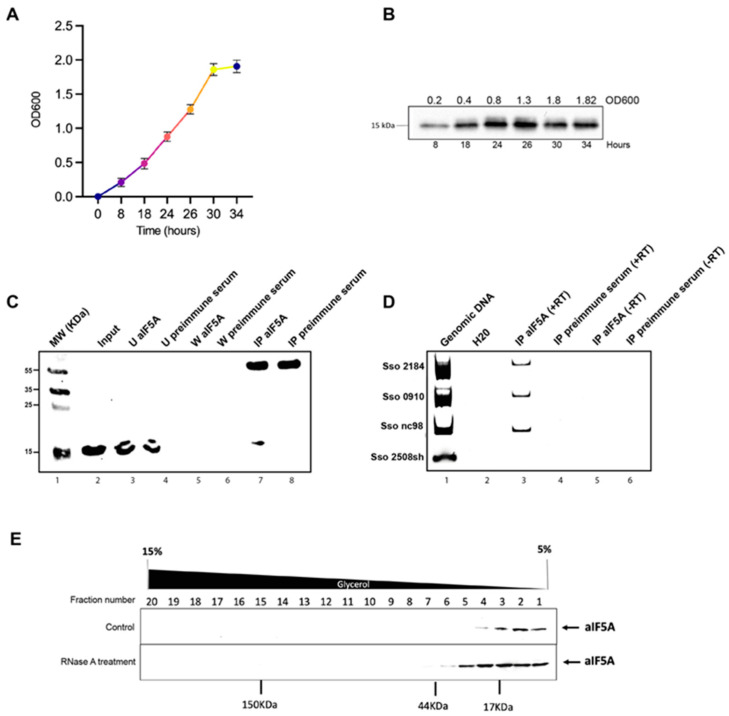
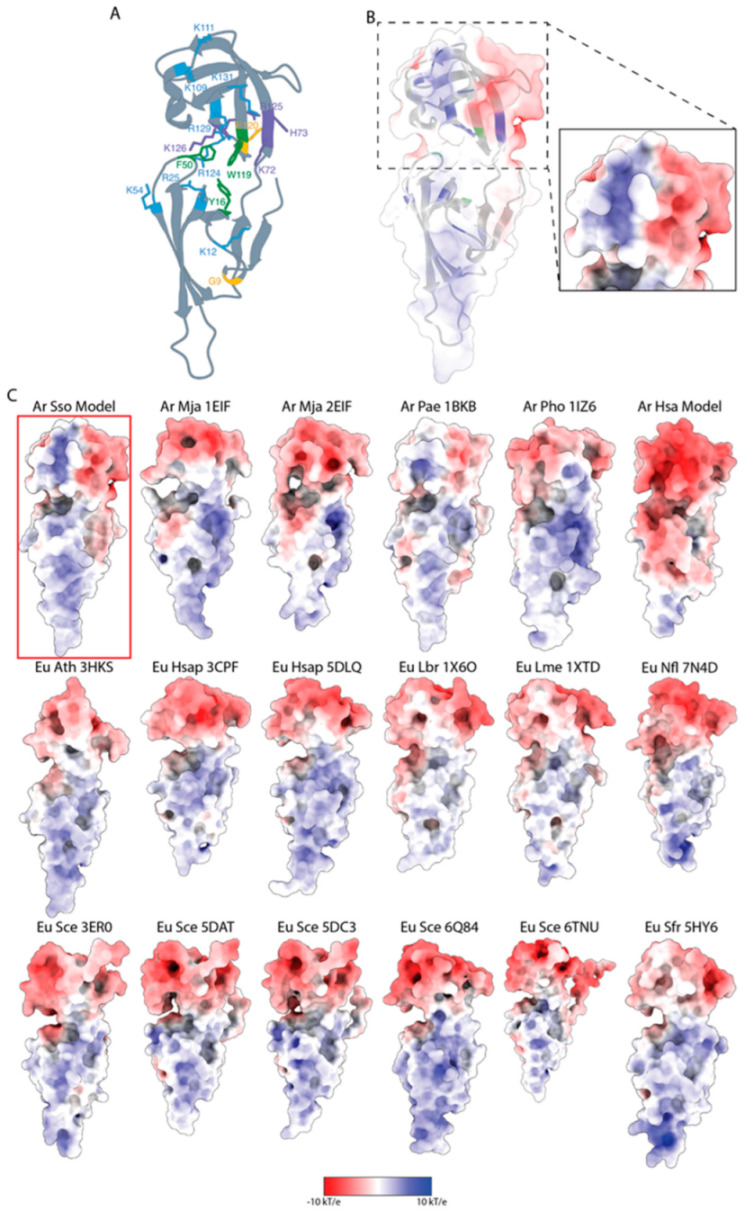
The translation factor IF5A is a highly conserved protein playing a well-recognized and well-characterized role in protein synthesis; nevertheless, some of its features as well as its abundance in the cell suggest that it may perform additional functions related to RNA metabolism. Here, we have undertaken a structural and functional characterization of aIF5A from the crenarchaeal Sulfolobus solfataricus model organism. We confirm the association of aIF5A with several RNA molecules in vivo and demonstrate that the protein is endowed with a ribonuclease activity which is specific for long and structured RNA. By means of biochemical and structural approaches we show that aIF5A can exist in both monomeric and dimeric conformations and the monomer formation is favored by the association with RNA. Finally, modelling of the three-dimensional structure of S. solfataricus aIF5A shows an extended positively charged surface which may explain its strong tendency to associate to RNA in vivo.

Keywords: Archaea; RNA metabolism; SAXS; Sulfolobus solfataricus; aIF5A; ribonuclease.


Conflict of interest statement

The authors declare no conflict of interest.

Figures

Figure 1
Figure 1
Expression of S. solfataricus aIF5A and its interaction with RNA molecules in vivo: (A) Growth curve of S. solfataricus P2 in Brock medium supplemented with 0.2% NZ amine and 0.2% sucrose. Growth of three replicates was further monitored. An amount of 15 mL of culture at 0.2 OD (8 h), 0.4 OD (18 h), 0.8 OD (24 h), 1.3 OD (26 h), 1.8 OD (30 h) and 1.82 (34 h) were harvested; (B) 20 μg of total protein from each lysate at different densities during the cell cycle were subjected to SDS-PAGE electrophoresis followed by Western blot and probed with anti-aIF5A; (C) native aIF5A immunoprecipitation from S. solfataricus post-ribosomal fraction (S100) with anti-aIF5A antibody and pre-immune serum and analysis of immunocomplexes by Western blotting, using anti-aIF5A. Lane 1: molecular weight protein marker; lane 2: input of native aIF5A in S100; lane 3–4: unbound fractions; lane 5–6: last wash fractions; lane 7–8: elution fractions.; (D) Reverse-Transcriptase-PCR with primers that amplified 2184, 0910, 2508sh mRNA and ncRNA98. Lane 1: S. solfataricus P2 genomic DNA amplification (control for PCR); lane 2: sample with H20, to exclude any contamination of genomic DNA in water used for PCR; lane 3–4: RNA-coimmunoprecipitated with native aIF5A (IP 5A); lane 5–6: RNAs in control samples of immunoprecipitation with preimmune serum. The reactions were carried out with (+RT) and without (-RT) Reverse Transcriptase, to exclude any DNA contamination; (E) Fractionation of 0.5 mg (total proteins) S. solfataricus S30 extract on glycerol gradients 5–15%, under normal condition or with a previous treatment of the extract with the RNase A. Aliquots of each fraction were resolved by SDS–polyacrylamide gel electrophoresis and immunoblotted with anti-aIF5A antibody.
Figure 2
Figure 2
aIF5A shows differences in its ribonucleolytic activity based on different RNA classes: Degradation assay of S. solfataricus 2184 mRNA (A) 0910 mRNA (B) or ncRNA 98 (C) with recombinant N-His-aIF5A (produced in E. coli, without hypusination) and Hyp-aIF5A (produced in S. solfataricus and hypusinated). Lane 1, RNAs incubated for 25 min at 65 °C in absence of proteins; lanes 2–7, time-course of degradation of RNAs with N-His-aIF5A (upper panel) and Hyp-aIF5A (lower panel) for 25 min at 65 °C. ImageLab software were used to quantify the RNA and the signal of the 0 min sample was set to 100%. The graphical representation shows the average of three independent experiments; the error bars represent standard deviations. (D) Degradation assay of total rRNA and tRNA with recombinant N-His-aIF5A. Total rRNA (lane 1) or total tRNA (lane 5) without incubation and in the absence of protein; total rRNA (lane 2) or total tRNA (lane 6) incubated for 30 min at 65 °C in the absence of protein; total rRNA (lane 3) or total tRNA (lane 7) incubated for 30 min at 65 °C in presence of 100 pmol (lane 3 and 7) or 200 pmol (lane 4 and 8) of N-His-aIF5A. (E) Degradation assay of 23S and 16S rRNA with recombinant N-His-aIF5A. 23S (lane 1) and 16S (lane 4) without incubation and in the absence of protein; 23S rRNA (lane 2) or 16S tRNA (lane 5) incubated for 30 min at 65 °C in the absence of protein; 23S rRNA (lane 3) or total tRNA (lane 6) incubated for 30 min at 65 °C in presence of 100 pmol of N-His-aIF5A.
Figure 3
Figure 3
Structural characterization of S. solfataricus aIF5A in solution: (A) The structures of modeled S. solfataricus aIF5A superimposed on P. arophilum aIF5A (PDB ID 1BKB) are shown in gray and light coral, respectively. The RMSD estimated between the C-α atoms of the structures is 0.120 Å; (B) 3D topology of S. solfataricus aIF5A modeled structure. The molecular structure is colored from the N-terminus (dark blue) to the C-terminus (red). In the depiction the location of the lysine 36 that is normally hypusinated is highlighted; (C,D) SAXS curves shown in log–log plots of the N-His-aIF5A. Each frame reports data at the same temperature, as indicated. The protein concentration of each sample is: 0.5 mg/mL (blue); 1 mg/mL (green); 2 mg/mL (yellow); 5 mg/mL (orange); 10 mg/mL (red). Samples in panel C contain 60 mM KCl, and the ones in panel D contain 1000 mM KCl. Error bars are reported every 10 points, for clarity Solid black lines are the best fit obtained with GENFIT (Equation (S7)); (E) Kratky plots of data reported in panel C. Curve have been divided by the protein concentration; (F) Guinier plot of data reported in (C). The solid black lines in panel f are the best Guinier/Porod fits (Equation (S1)), whereas the dashed black lines are the Guinier law contribution (first term of Equation (S1)). Kratky and Guinier plots of data corresponding to panel D are shown in Figures S3 and S4.
Figure 4
Figure 4
SAXS analysis of N-His-aIF5A in the presence of rRNA at 63 °C: (AC) SAXS curves reported in log–log, Kratky and Guinier plots. The protein and the rRNA concentrations of each sample are: 0 and 2.5 mg/mL (blue); 0.5 and 2.5 mg/mL (green); 1 and 2.5 mg/mL (yellow); 4 and 1.75 mg/mL (orange); 6 and 1 mg/mL (red). These values correspond to the protein/rRNA w/w ratio ranging from 0 to 6. Curves in panel C have been multiplied by a factor 10 for the sake of a better visualization. The solid black lines in panel C are the best Guinier/Porod fits (Equation (S1)), whereas the dashed black lines are the Guinier law contribution (first term of Equation (S1)). (D) The obtained radii of gyration as a function of the protein/rRNA ratio. The solid black line is the best fit obtained with Equation (2).
Figure 5
Figure 5
IF5A RNA-binding and cleavage structural characteristic. (A) 3D ribbon illustration of S. solfataricus aIF5A where basic residues (i.e., K12, R25, K54, K109, K111, R124, R129, and K131), aromatic residues (i.e., Y16, F50, W119), common residues (i.e., K72, H73, R125, and K126) identified from the pairwise alignment with Halobacterium sp. NRC-1 amino acid sequence (reported from the work by Wagner et al. [25]) and hypothetical residues (i.e., G9 and E120) involved in RNAse activity (reported from the work by Wagner et al. [25]) are depicted in light blue, green, purple and yellow, respectively. (B) S. solfataricus aIF5A 3D ribbon illustration with electrostatic potential mapped on molecular surface. The ribbon structure depicts the essential basic and aromatic residues in blue and green, respectively. The electrostatic potential projected on the molecular surface of the OB-Fold region of S. solfataricus aIF5A is shown in the inset. (C) Electrostatic potentials are represented by the color of the molecular surfaces of several archaea and eukaryotic IF5A proteins: red is negative, blue is positive, and white is neutral. The model structure of S. solfataricus aIF5A is outlined in red. All the structures were refined and utilized to determine the EPS with the ABPS tool applying continuum solvation techniques. All structures were superimposed on S. solfataricus aIF5A to achieve the same spatial orientation. Surface potentials range from −10.0 kT/e (red) to 10 kT/e (blue). When no PDB code is given, the structure is a model. Ar, Archaea; Eu, Eukarya; Sso, Sulfolobus solfataricus; Mja, Methanocaldococcus jannaschii; Pae, Pyrobaculum aerophilum; Pho, Pyrococcus horikoshii; Hsa, Halobacterium sp. NRC-1; Ath, Arabidopsis thaliana; Hsap, Homo sapiens; Lbr, Leishmania braziliensis; Lme, Leishmania Mexicana; Nfl, Naegleria fowleri; Sce, Saccharomyces cerevisiae; Sfr, Spodoptera frugiperda.

References

    1. Kyrpides N.C., Woese C.R. Universally Conserved Translation Initiation Factors. Proc. Natl. Acad. Sci. USA. 1998;95:224–228. doi: 10.1073/pnas.95.1.224. - DOI - PMC - PubMed
    1. Benelli D., Londei P. Begin at the Beginning: Evolution of Translational Initiation. Res. Microbiol. 2009;160:493–501. doi: 10.1016/j.resmic.2009.06.003. - DOI - PubMed
    1. Dever T.E., Gutierrez E., Shin B.S. The Hypusine-Containing Translation Factor EIF5A. Crit. Rev. Biochem. Mol. Biol. 2014;49:413–425. doi: 10.3109/10409238.2014.939608. - DOI - PMC - PubMed
    1. Park J.H., Dias C.A.O., Lee S.B., Valentini S.R., Sokabe M., Fraser C.S., Park M.H. Production of Active Recombinant EIF5A: Reconstitution in E.Coli of Eukaryotic Hypusine Modification of EIF5A by Its Coexpression with Modifying Enzymes. Protein Eng. Des. Sel. 2011;24:301–309. doi: 10.1093/protein/gzq110. - DOI - PMC - PubMed
    1. Golubev A.A., Validov S.Z., Usachev K.S., Yusupov M.M. Elongation Factor P: New Mechanisms of Function and an Evolutionary Diversity of Translation Regulation. Mol. Biol. 2019;53:501–512. doi: 10.1134/S0026893319040034. - DOI - PubMed

Publication types

MeSH terms

LinkOut - more resources