. 2022 Oct 11;12(10):1455.
doi: 10.3390/biom12101455.

Simulation of Calcium Dynamics in Realistic Three-Dimensional Domains

Affiliations

Simulation of Calcium Dynamics in Realistic Three-Dimensional Domains

James Sneyd et al. Biomolecules. .

Abstract

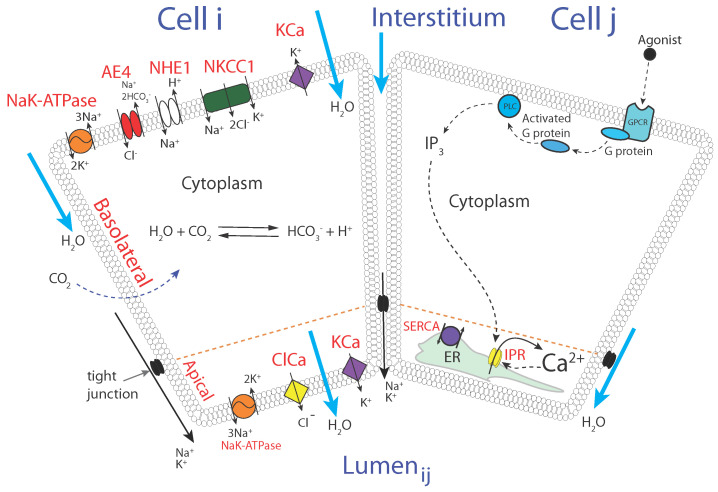
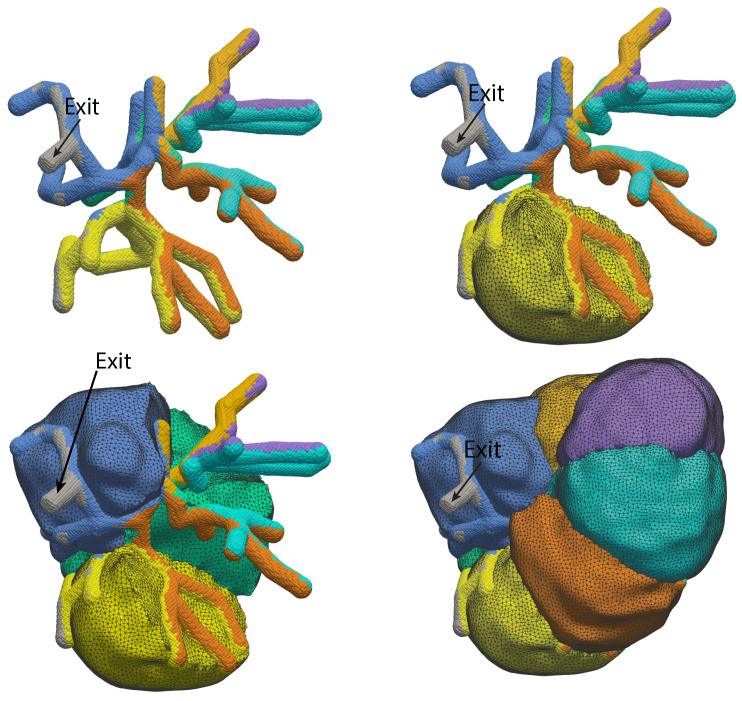
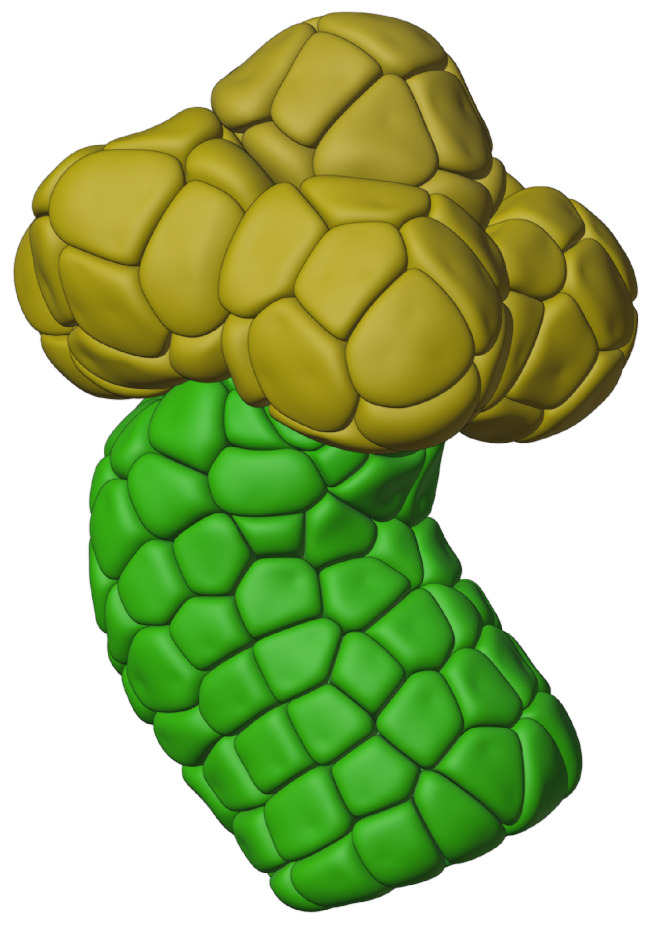
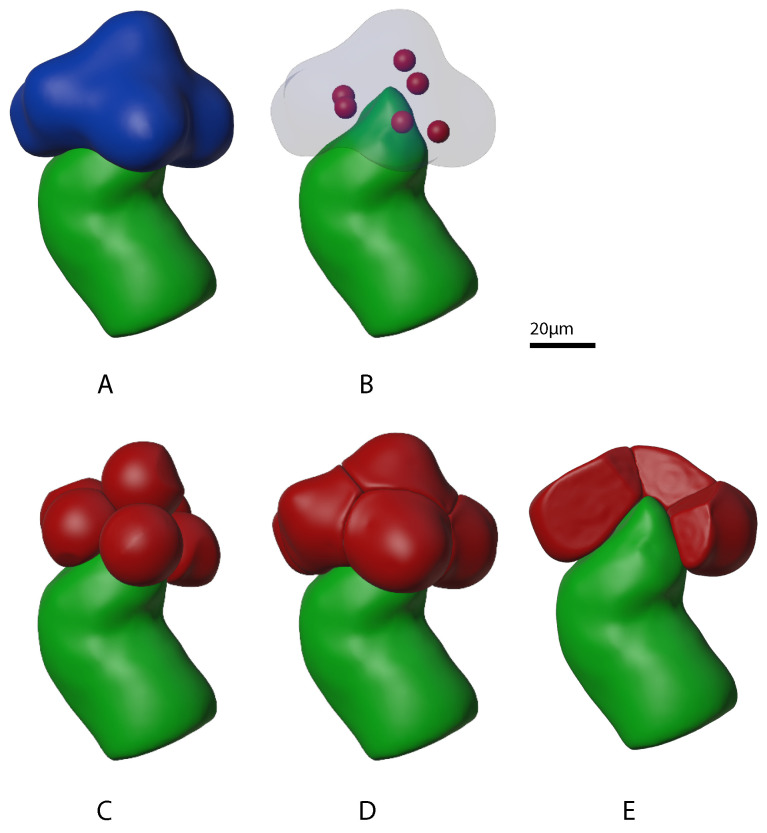
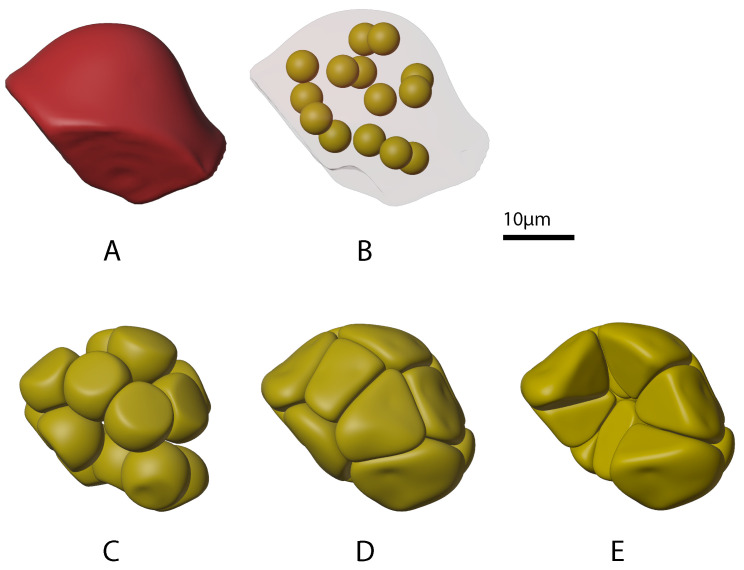
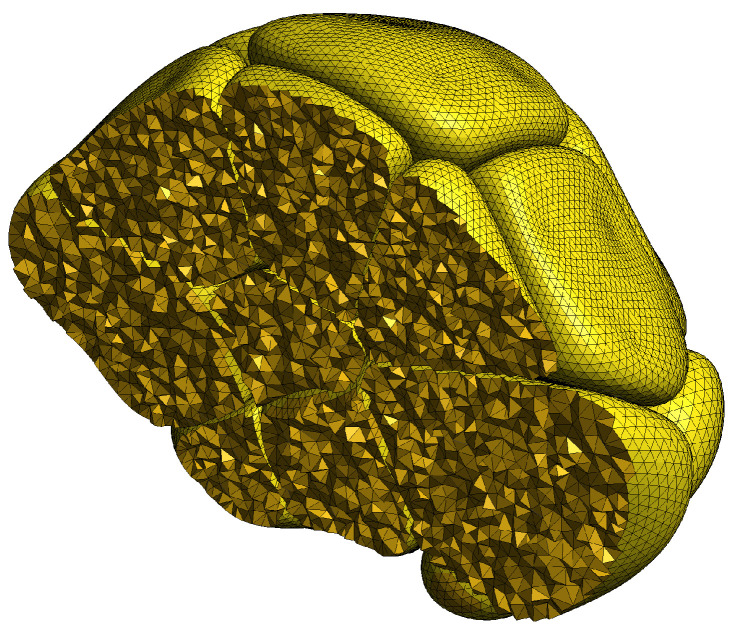
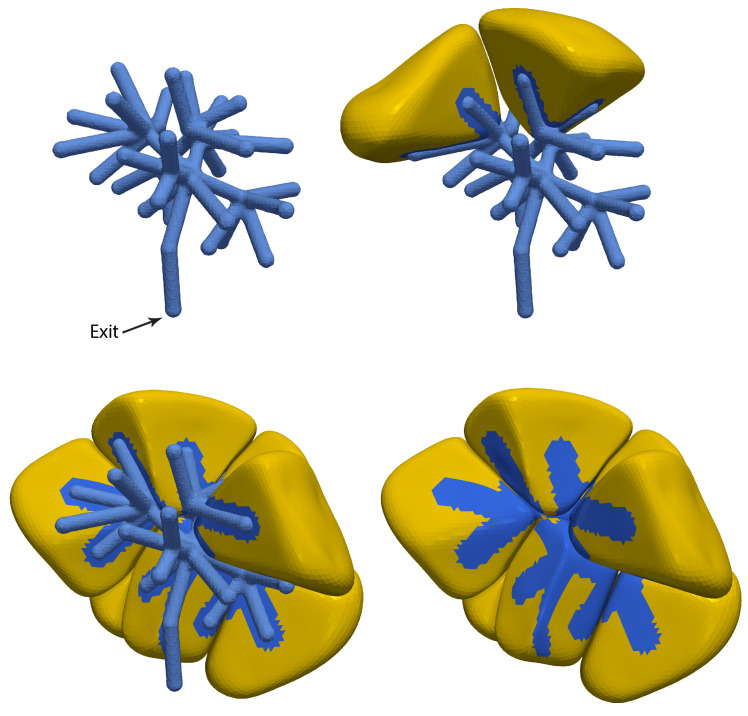
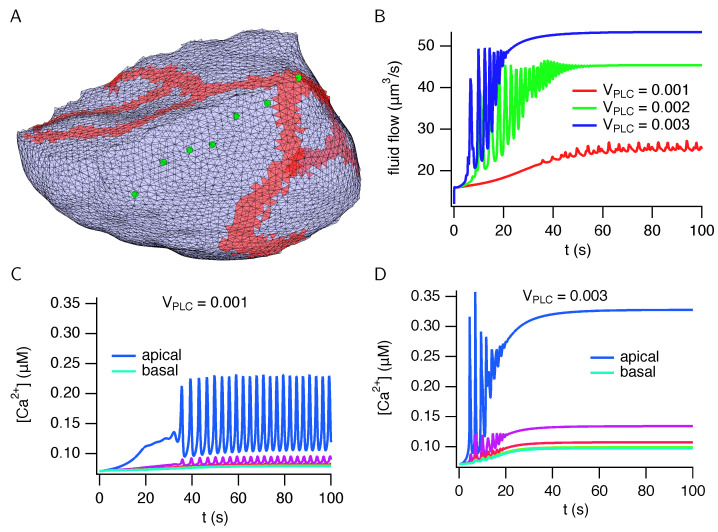
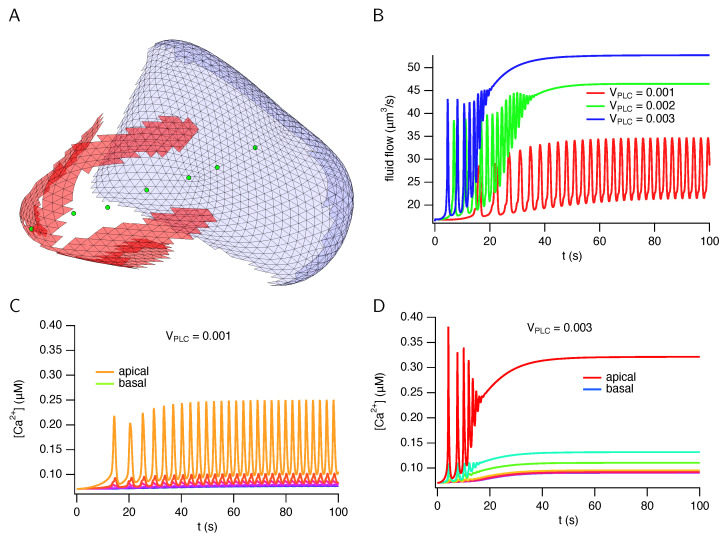
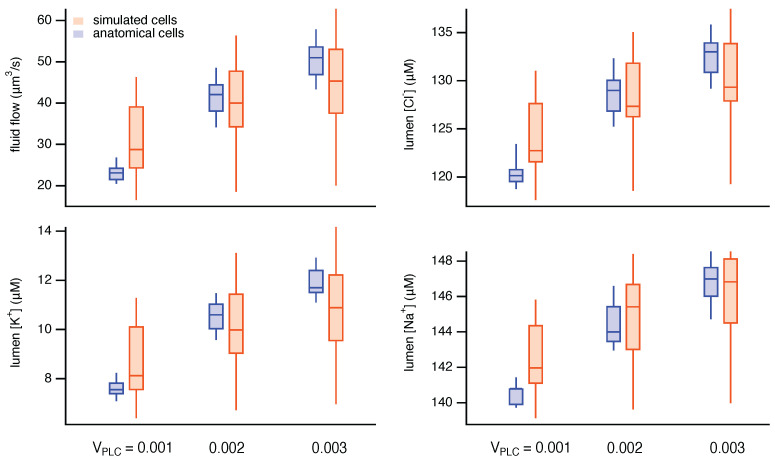
The cytosolic concentration of free calcium ions ([Ca2+]) is an important intracellular messenger in most cell types, and the spatial distribution of [Ca2+] is often critical. In a salivary gland acinar cell, a polarised epithelial cell, whose principal function is to transport water and thus secrete saliva, [Ca2+] controls the secretion of primary saliva, but increases in [Ca2+] are localised to the apical regions of the cell. Hence, any quantitative explanation of how [Ca2+] controls saliva secretion must take into careful account the spatial distribution of the various Ca2+ sources, Ca2+ sinks, and Ca2+-sensitive ion channels. Based on optical slices, we have previously constructed anatomically accurate three-dimensional models of seven salivary gland acinar cells, and thus shown that a model in which Ca2+ responses are confined to the apical regions of the cell is sufficient to provide a quantitative and predictive explanation of primary saliva secretion. However, reconstruction of such anatomically accurate cells is extremely time consuming and inefficient. Here, we present an alternative, mostly automated method of constructing three-dimensional cells that are approximately anatomically accurate and show that the new construction preserves the quantitative accuracy of the model.

Keywords: calcium dynamics; finite-element methods; saliva secretion; three-dimensional simulations.


Conflict of interest statement

The authors declare no conflict of interest.

Figures

Figure 1
Figure 1
Schematic diagram of the processes underlying water transport by salivary gland acinar cells. Two identical cells are shown; cell i shows the relevant ion channels and transporters, while cell j shows the principal components of the Ca2+ response. Although the two sets of processes are separated here for clarity, all the processes are present in all salivary gland acinar cells. Abbreviations are PLC (phospholipase C); IP3 (inositol trisphosphate); IPR (IP3 receptor); ER (endoplasmic reticulum); SERCA (sarcoplasmic/ER Ca2+ ATPase); KCa (Ca2+-activated K+ channel); ClCa (Ca2+-activated Cl channel); NKCC1 (Na+/K+/Cl cotransporter); NHE1 (Na+/H+ exchanger); AE4 (anion exchanger). We note that these channels and exchangers are not the only ones present in the cell but are the components that are believed to be the most important for the control of water transport in this cell type. Thus, other channels and exchangers (such as, for example, RyR or Na/Ca exchangers) that are known to be critical in other cell types are not included here.
Figure 2
Figure 2
Three-dimensional reconstruction of a group of seven salivary gland acinar cells, based on data from optical slices. The panels show four different views of the same group of cells, with progressively more cells included, so that the internal structure can be more clearly seen. The top left panel shows the reconstruction of the apical lumen, with the exit to the duct shown. It is colour-coded by which cell secretes into that branch of the lumen. The top right panel shows the same lumen, but now with one acinar cell included, to demonstrate how the fingers of the lumen wrap around the cell. The bottom two panels show three and seven cells, with the same colour coding.
Figure 3
Figure 3
Artificial cells of a “mini-gland” subset of a salivary gland. This subset, which is replicated many times in a real salivary gland, forms the upstream beginning site of saliva production. Acinar cells are shown in yellow colour, duct cells are shown in green.
Figure 4
Figure 4
Progression of mini-gland individual acinus outer boundary “growth” stages. The mini-gland duct cell outer boundary from our prior work [27] is shown in green. (Panel A) shows the mini-gland acini outer boundary in blue. (Panel B) shows the arrangement of six individual acinus “seeds” in red. (Panel C) shows partially grown individual acini and (Panel D) shows the fully grown acini. (Panel E) shows the mini-gland with several of the acinus outer boundaries (red) removed. Note that the acini are packed tightly against each other as well as to the tip of the mini-gland duct outer boundary.
Figure 5
Figure 5
Progression of mini-gland acinus cell “growth” stages for one of the acini. (Panel A) shows one of the acinus outer boundaries in red colour. (Panel B) shows the arrangement of fourteen individual acinus cell “seeds” in yellow. (Panel C) shows partially grown acinus cells and (Panel D) shows the fully grown cells. (Panel E) shows the acinus with several of the cells removed. Note that the acinar cells are packed tightly together and conform to the associated acinus outer boundary.
Figure 6
Figure 6
This cutaway view of a reconstructed acinus displays the volumetric tetrahedralization of each cell that is required by the three-dimensional finite element method used in our simulations. Additionally, the surface of each cell is partitioned into associated triangle patches, which are required in the simulation calculations for modelling boundary conditions.
Figure 7
Figure 7
Three-dimensional reconstruction of an apical lumen “tree” associated with a 14-cell acinus. The panels show four different views of the same acinus. The (top left panel) shows the apical lumen reconstruction, with the exit (to the duct) labelled. The (top right panel) shows the same lumen, but now with two acinar cells included, to show how the fingers of the lumen wrap around each cell. Additional cells are show in the (bottom two panels), with the lumen tree removed in the (bottom right panel), fully exposing a view of the surface triangles.
Figure 8
Figure 8
Calcium responses and fluid flow in a cell (cell 1) reconstructed from anatomical data. (A): the cell membrane, showing the triangles used in the finite element mesh. Red triangles are apical membrane and blue triangles are basolateral membrane. The green circles show the places for which the Ca2+ responses are plotted in panels (C,D). (B): total fluid flow plotted over time for three different stimulation levels. (C,D): Ca2+ responses from six different positions in the cell, denoted by the green circles in (panel A).
Figure 9
Figure 9
Calcium responses and fluid flow in a simulated cell. (A): the cell membrane, showing the triangles used in the finite element mesh. Red triangles are apical membrane and blue triangles are basal membrane. The lateral membrane (which abuts neighbouring cells) is omitted for clarity. The green circles show the places for which the Ca2+ responses are plotted in panels (C,D). (B): total fluid flow plotted over time for three different stimulation levels. (C,D): Ca2+ responses from seven different positions in the cell, denoted by the green circles in (panel A).
Figure 10
Figure 10
Steady-state fluid flow and lumenal ionic concentrations in simulated and anatomical cells in response to three stimulation levels. The horizontal line within each box shows the median of the relevant group, the vertical lines (the “whiskers”) extend to the maximum and minimum point in each group, while the box extends from the first quartile to the third quartile.

References

    1. Berridge M.J. Calcium oscillations. J. Biol. Chem. 1990;265:9583–9586. doi: 10.1016/S0021-9258(19)38704-6. - DOI - PubMed
    1. Cobbold P.H., Cuthbertson K.S. Calcium oscillations: Phenomena, mechanisms and significance. Semin. Cell Biol. 1990;1:311–321. - PubMed
    1. Berridge M.J. Inositol trisphosphate and calcium oscillations. Adv. Second Messenger Phosphoprot. Res. 1992;26:211–223. doi: 10.1042/BSS0740001. - DOI - PubMed
    1. Dupont G., Falcke M., Kirk V., Sneyd J. Models of Calcium Signalling. Volume 43. Springer; Berlin, Germany: 2016. Interdisciplinary Applied Mathematics. - DOI
    1. Allbritton N.L., Meyer T., Stryer L. Range of messenger action of calcium ion and inositol 1,4,5-trisphosphate. Science. 1992;258:1812–1815. doi: 10.1126/science.1465619. - DOI - PubMed

Publication types

LinkOut - more resources