. 2022 Oct 13;12(10):1471.
doi: 10.3390/biom12101471.

Receptor Transporter Protein 4 (RTP4) in the Hypothalamus Is Involved in the Development of Antinociceptive Tolerance to Morphine

Affiliations

Receptor Transporter Protein 4 (RTP4) in the Hypothalamus Is Involved in the Development of Antinociceptive Tolerance to Morphine

Wakako Fujita et al. Biomolecules. .

Abstract

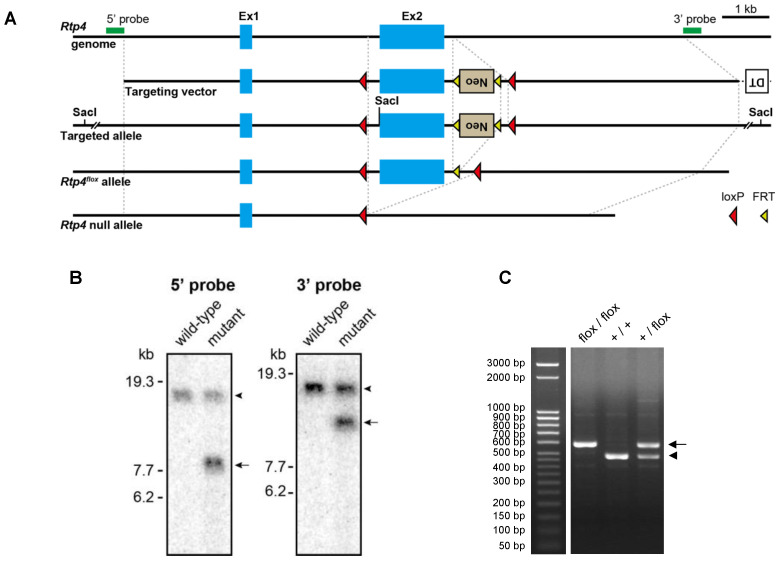
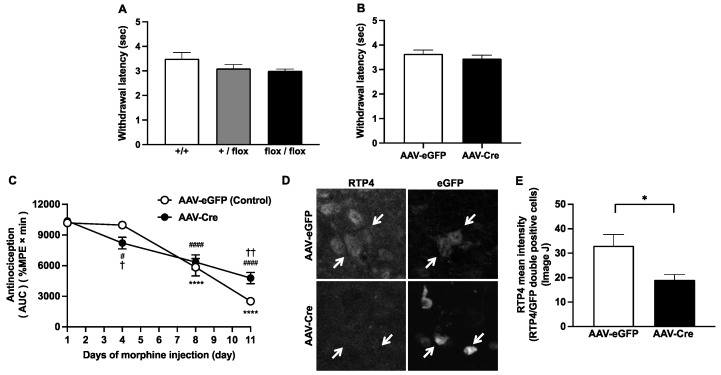
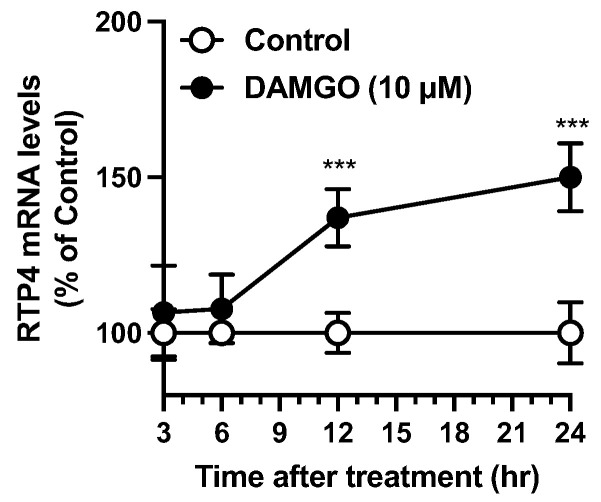
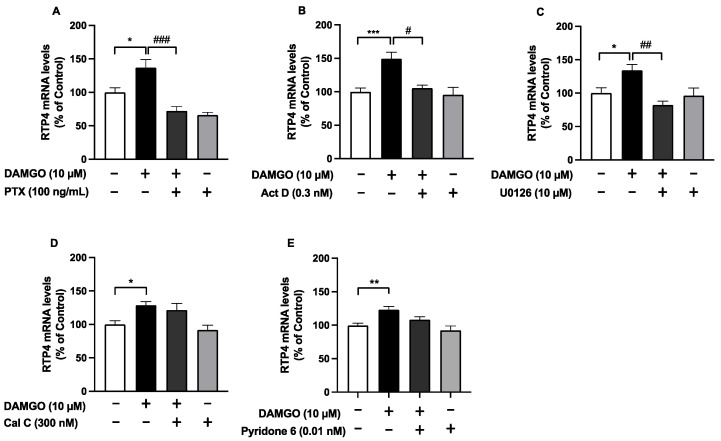
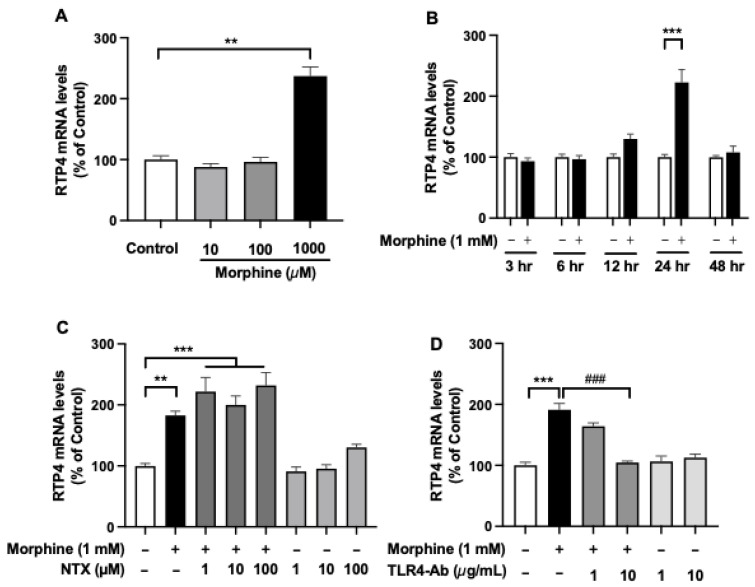
Receptor transporter protein 4 (RTP4), one of the receptor chaperone proteins, contributes to the maturation and membrane trafficking of opioid receptor heteromers consisting of mu (MOPr) and delta (DOPr) opioid receptors (MOPr-DOPr). Although MOPr-DOPr is known to mediate the development of morphine tolerance, the extent to which RTP4 plays a role in this process has not been elucidated. Given that RTP4 can be upregulated by repeated administration of morphine, especially in the hypothalamus, here we investigated the effect of hypothalamus-selective ablation of RTP4 on the development of antinociceptive tolerance to morphine. In this study, we generated RTP4flox mice and selectively knocked-out RTP4 using local injection of adeno-associated virus expressing Cre recombinase (AAV-Cre) into the hypothalamus. The AAV-Cre injection partially, but significantly, decreased the level of RTP4 expression, and suppressed the development of antinociceptive tolerance to morphine. Next, we examined the mechanism of regulation of RTP4 and found that, in neuronal cells, Rtp4 induction is via Gi and MAPK activation, while, in microglial cells, the induction is via Toll-like receptor 4. Together, these studies highlight the role of MOR activity in regulating RTP4, which, in turn, plays an important role in modulating morphine effects in vivo.

Keywords: mitogen-activated protein kinase; mu-opioid receptor; paraventricular nucleus; receptor transporter protein 4; tolerance; toll-like receptor 4.


Conflict of interest statement

The authors declare no conflict of interest.

Figures

Figure 1
Figure 1
Generation of Rtp4-floxed mice. Schema illustrating the strategy for the generation of Rtp4flox mice and conditional KO of the Rtp4 gene (A). Filled blue boxes delineate exon 1 and 2 (Ex1 and 2) of the Rtp4 gene. Green bars indicate probes used in Southern blot analysis. Southern blot analysis of genomic DNA from wild-type mice and heterozygous mutant mice carrying the targeted allele (B). Hybridization with a 5′ or 3′ probe detected the 17.68-kb wild-type band (arrowhead) and 8.24- or 11.37-kb target allele bands (arrows) in Sac I-digested DNA (left and right panels). PCR genotyping of Rtp4-floxed mice (C) showing the 482-bp wild-type allele band (arrowhead) and 583-bp Rtp4flox allele band (arrow).
Figure 2
Figure 2
The effect of genotype on the pain sensitivity determined by tail-flick test (A,B). The influence of genotype (A) and the influence of AAV-Cre injection (B) on thermal pain sensitivity. Data are the mean ± SEM. n = 5–14 (A), n = 8 (B). +/+, wild type; +/flox, floxed hetero; flox/flox, floxed homo. The effect of knockdown of RTP4 in PVN on the development of antinociceptive tolerance to morphine (C). The daily changes in antinociceptive effect of morphine during repeated administration. Data are the mean ± SEM. n = 7 (AAV-eGFP) (control), n = 10 (AAV-Cre), **** p < 0.0001 vs. Day1 (AAV-eGFP); # p < 0.05, #### p < 0.0001 vs. Day1 (AAV-Cre), Dunnett’s multiple comparison test; p < 0.05, †† p < 0.01 vs. AAV-eGFP (control), repeated measures ANOVA and the post-hoc Tukey’s multiple comparisons test. The effect of AAV-Cre on RTP4 expression in PVN area (D and E). Representative images of the immunohistochemical signal for RTP4 and the AAV-eGFP signal of the virus infected in the PVN area. Arrows indicate the eGFP-positive cell. The mean intensity of the RTP4 signal in eGFP-positive cells were measured by Image J software, as described in the Methods section (E). The mean signal intensity of RTP4 in the RTP4/eGFP double-positive cells were measured from a single cryostat brain section, including the PVN region from 7 (AAV-eGFP) and 6 (AAV-Cre) mice. Ten to 40 eGFP-positive cells were measured from each section. Data are the mean ± SEM. n = 7 (AAV-eGFP) (control), n = 6 (AAV-Cre), * p < 0.05 unpaired t-test.
Figure 3
Figure 3
Time dependent increase of RTP4 mRNA levels after DAMGO treatment. N2AMOPr cells (2 × 10⁵ cells/well) were treated with DAMGO (10 µM) at indicated periods. RT-qPCR was performed with specific primers against RTP4 and GAPDH. Data are the mean ± S.E.M. n = 5–6, *** p < 0.001 vs. control, unpaired t-test.
Figure 4
Figure 4
The effect of inhibitors of signal transduction molecules on DAMGO-induced (24 h) increase in RTP4 mRNA levels (AD). N2AMOPr cells (2 × 10⁵ cells/well) were treated with DAMGO (10 µM) without or with pre-treatment, with inhibitors at the indicated concentrations for 24 h (PTX) (A) or 30 min (ActD (B), U0126 (C), Cal C (D), Pyridone 6 (E)) before addition of DAMGO. RT-qPCR was performed with specific primers against RTP4 and GAPDH. Data are the mean ± SEM. n = 5–31, * p < 0.05, ** p < 0.01, *** p < 0.001 vs. control (open bar); # p < 0.05, ## p < 0.01, ### p < 0.001 vs. DAMGO (closed bar), Tukey’s multiple comparisons test.
Figure 5
Figure 5
The effect of morphine on the RTP4 mRNA levels in the microglial cell line. SIM-A9 cells (8 × 10⁴ cells/well) were treated with morphine (10 µM to 1 mM) (A,B) without or with pre-treatment with MOPr antagonist (NTX) (C) or TLR4 antibody (TLR4-Ab) (D) at the indicated concentrations for 30 min before addition of DAMGO. RT-qPCR was performed with specific primers against RTP4 and GAPDH. Data are the mean ± SEM. n = 3–10, ** p < 0.01, *** p < 0.001 vs. control (open bar); ### p < 0.001 vs. morphine (closed black bar), Tukey’s multiple comparisons test.

References

    1. Mainland J., Matsunami H. RAMP like proteins: RTP and REEP family of proteins. Adv. Exp. Med. Biol. 2012;744:75–86. - PubMed
    1. Behrens M., Bartelt J., Reichling C., Winnig M., Kuhn C., Meyerhof W. Members of RTP and REEP gene families influence functional bitter taste receptor expression. J. Biol. Chem. 2006;281:20650–20659. doi: 10.1074/jbc.M513637200. - DOI - PubMed
    1. Decaillot F.M., Rozenfeld R., Gupta A., Devi L.A. Cell surface targeting of mu-delta opioid receptor heterodimers by RTP4. Proc. Natl. Acad. Sci. USA. 2008;105:16045–16050. doi: 10.1073/pnas.0804106105. - DOI - PMC - PubMed
    1. BioJPS. [(accessed on 8 August 2022)]. Available online: http://biogps.org.
    1. [(accessed on 28 September 2022)]. Available online: http://mousebrain.org/adolescent/genesearch.html.

Publication types