. 2022 Oct 13;14(20):5001.
doi: 10.3390/cancers14205001.

CSMD1 Shows Complex Patterns of Somatic Copy Number Alterations and Expressions of mRNAs and Target Micro RNAs in Esophageal Squamous Cell Carcinoma

Affiliations

CSMD1 Shows Complex Patterns of Somatic Copy Number Alterations and Expressions of mRNAs and Target Micro RNAs in Esophageal Squamous Cell Carcinoma

Nan Hu et al. Cancers (Basel). .

Abstract

Background: Human Cub and Sushi Multiple Domains 1 (CSMD1) is a novel candidate tumor-suppressor gene that codes for multiple domains, including complement regulatory and adhesion proteins, and has recently been shown to have alterations in multiple cancers. We investigated CSMD1 in esophageal squamous cell carcinoma (ESCC) by performing an integrated analysis on somatic copy number alterations (CNAs), including copy-number gain or loss, allelic imbalance (AI), loss of heterozygosity (LOH), and the expressions of mRNA and its target miRNAs on specimens from the same patients with ESCC.

Results: (i) Two-thirds of ESCC patients had all three types of alterations studied-somatic DNA alterations in 70%, and abnormal expressions of CSMD1 RNA in 69% and in target miRNAs in 66%; patterns among these alterations were complex. (ii) In total, 97% of 888 CSMD1 SNPs studied showed somatic DNA alterations, with most located near exons 4-11, 24-25, 39-40, 55-56, and 69-70. (iii) In total, 68% of SNPs with a CNA were correlated with expression of CSMD1. (iv) A total of 33 correlations between non-coding SNPs and expression of CSMD1 target miRs were found.

Conclusions: Our results indicate that the CSMD1 gene may play a role in ESCC through complex patterns of DNA alterations and RNA and miRNA expressions. Alterations in some somatic SNPs in non-coding regions of CSMD1 appear to influence expression of this gene and its target miRNAs.

Keywords: CSMD1; allelic imbalance; esophageal squamous cell carcinoma; gene expression; miRNA; somatic copy number alternation.


Conflict of interest statement

The authors declare no conflict of interest.

Figures

Figure 1
Figure 1
Distribution of somatic DNA alterations on CSMD1 in 56 ESCC.
Figure 2
Figure 2
(a) Distribution of mRNA expression of CSMD1 in ESCC. The yellow bar indicates the frequency of cases with overexpression (fold change (FC) ≥ 2.00); green bar indicates frequency of cases with underexpression (FC ≤ 0.50); blue bar indicates frequency of cases with expression in the normal range (FC 0.51–1.99). (b) Individual ESCC case mRNA expression levels for the 11 exon boundaries studied, shown as fold change (FC) (top, heatmap) and as median, range, and mean across the 54 cases examined in each of the 11 exons tested (bottom). Each row in the heatmap represents an individual case, and each column represents mRNA expression levels in a single exon boundary tested. FC ranges from lowest (0.02, blue) to highest (315.15, yellow). Gray denotes probe with no data available.
Figure 3
Figure 3
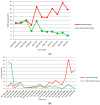
(a) Distribution of expression levels of CSMD1 miRNA targets in ESCC cases. Red bars indicate miR overexpression (FC ≥ 2.00), green bars indicate miR underexpression (FC ≤ 0.50), and yellow bars indicate miR expression in the normal range (FC 0.49–1.99). (b) CSMD1 target miR expression median fold change (FC) across 22 miRs, with the miRs shown across the horizontal axis.
Figure 3
Figure 3
(a) Distribution of expression levels of CSMD1 miRNA targets in ESCC cases. Red bars indicate miR overexpression (FC ≥ 2.00), green bars indicate miR underexpression (FC ≤ 0.50), and yellow bars indicate miR expression in the normal range (FC 0.49–1.99). (b) CSMD1 target miR expression median fold change (FC) across 22 miRs, with the miRs shown across the horizontal axis.
Figure 4
Figure 4
(a) Scatter chart of significant correlations between somatic CNAs in SNPs and mRNA expression of CSMD1 in ESCC. Negative rho values on left side indicate inverse correlations; positive rho values on right side indicate positive correlations. (b) Significant correlations between SNPs with alterations and miR expression (p < 0.05). The y-axis is rho value, and the x-axis is the significantly correlated SNP. Each blue bar presents one correlation. (c) Significant correlations between expressions of CSMD1 and its target miRNAs in ESCC. The x-axis shows exon number and target miR number; y-axis shows rho value (blue line) and p-value (orange line).
Figure 4
Figure 4
(a) Scatter chart of significant correlations between somatic CNAs in SNPs and mRNA expression of CSMD1 in ESCC. Negative rho values on left side indicate inverse correlations; positive rho values on right side indicate positive correlations. (b) Significant correlations between SNPs with alterations and miR expression (p < 0.05). The y-axis is rho value, and the x-axis is the significantly correlated SNP. Each blue bar presents one correlation. (c) Significant correlations between expressions of CSMD1 and its target miRNAs in ESCC. The x-axis shows exon number and target miR number; y-axis shows rho value (blue line) and p-value (orange line).
Figure 5
Figure 5
(a) CSMD1 expression in ESCC with and without somatic copy number alterations, allelic imbalance, and LOH. (b) Expression of CSMD1 target miRNAs in ESCC with and without somatic copy number alterations, allelic imbalance, and LOH.
Figure 6
Figure 6
(a) ESCC case survival by miR-19b expression (Kaplan–Meier plot, HR from proportional hazards model). (b) ESCC case survival by miR-130b* expression (Kaplan–Meier plot, HR from proportional hazards model).

References

    1. Sun P.C., Uppaluri R., Schmidt A.P., Pashia M.E., Quant E.C., Sunwoo J.B., Gollin S., Scholnick S.B. Transcript map of the 8p23 putative tumor suppressor region. Genomics. 2001;75:17–25. doi: 10.1006/geno.2001.6587. - DOI - PubMed
    1. Kamal M., Shaaban A.M., Zhang L., Walker C., Gray S., Thakker N., Toomes C., Speirs V., Bell S.M. Loss of CSMD1 expression is associated with high tumour grade and poor survival in invasive ductal breast carcinoma. Breast Cancer Res. Treat. 2010;121:555–563. doi: 10.1007/s10549-009-0500-4. - DOI - PubMed
    1. Escudero-Esparza A., Kalchishkova N., Kurbasic E., Jiang W.G., Blom A.M. The novel complement inhibitor human CUB and Sushi multiple domains 1 (CSMD1) protein promotes factor I-mediated degradation of C4b and C3b and inhibits the membrane attack complex assembly. FASEB J. 2013;27:5083–5093. doi: 10.1096/fj.13-230706. - DOI - PubMed
    1. Kraus D.M., Elliott G.S., Chute H., Horan T., Pfenninger K.H., Sanford S.D., Foster S., Scully S., Welcher A.A., Holers V.M. CSMD1 is a novel multiple domain complement-regulatory protein highly expressed in the central nervous system and epithelia tissues. J. Immunol. 2006;176:4419–4430. doi: 10.4049/jimmunol.176.7.4419. - DOI - PubMed
    1. Ma C., Quesnelle K.M., Sparano A., Rao S., Park M.S., Cohen M.A., Wang Y., Samanta M., Kumar M.S., Aziz M.U., et al. Characterization CSMD1 in a large set of primary lung, head and neck, breast and skin cancer tissues. Cancer Biol. Ther. 2009;8:907–916. doi: 10.4161/cbt.8.10.8132. - DOI - PubMed