Automatic Quantitative Assessment of Lens Opacities Using Two Anterior Segment Imaging Techniques: Correlation with Functional and Surgical Metrics
- PMID: 36292095
- PMCID: PMC9600551
- DOI: 10.3390/diagnostics12102406
Automatic Quantitative Assessment of Lens Opacities Using Two Anterior Segment Imaging Techniques: Correlation with Functional and Surgical Metrics
Abstract
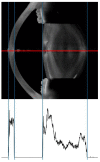
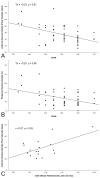
The purpose of this study is to quantitatively assess lens opacity, using a swept-source optical coherence tomography (SS-OCT) device for anterior segment assessment, and establish the correlation with Scheimpflug imaging, corrected distance visual acuity (CDVA) and cumulative dissipated energy (CDE). This prospective cross-sectional single-center study enrolled 51 patients (51 eyes) with crystalline lens opacity. Patients with previous ocular surgery, pathologies or general disorders affecting vision were excluded. Eyes were scanned with an SS-OCT device, and lens densitometry was automatically analyzed using a custom MATLAB script which examined lens density, nuclear density and linear density. The same analyses were performed on Scheimpflug images. Preoperative CDVA and CDE during phacoemulsification were recorded. Spearman’s (ρ) and Pearson’s (r) correlation coefficients were assessed according to data normality. Statistically significant correlations were established between SS-OCT and Scheimpflug imaging using lens analysis (ρ = 0.47, p < 0.001), nuclear analysis (ρ = 0.73, p < 0.001) and linear analysis (r = 0.44, p < 0.001). A significant correlation with CDE was found with all the SS-OCT methods (r = 0.57, p < 0.001). Only the nuclear analysis of the SS-OCT scans (Tb = −0.33, p < 0.01) and Pentacam Nucleus Staging (Tb = −0.26, p < 0.05) showed a statistically significant correlation with CDVA. Good inter-device agreement in lens densitometry was found. However, SS-OCT yielded improved lens imaging compared with the Scheimpflug device and a higher correlation with clinical parameters. Thus, high-resolution SS-OCT has the potential to become a preferable option for automatic cataract grading and preoperative planning.
Keywords: Scheimpflug imaging; anterior segment OCT; cataract.
Conflict of interest statement
L. H. B. Mackenbrock: none; G. Łabuz: none; T. M. Yildirim: Alcon (honoraria for lecture); G. U. Auffarth: Alcon (research grant and honoraria for lecture), Heidelberg Engineering and Oculus (honoraria for lecture); R. Khoramnia: Alcon (research grant and honoraria for lecture), Heidelberg Engineering and Oculus (honoraria for lecture). The funders had no role in the design of the study; in the collection, analyses, or interpretation of data; in the writing of the manuscript; or in the decision to publish the results.
Figures


References
LinkOut - more resources
Full Text Sources

