

Associations between Bone Mineral Density and Longitudinal Changes of Vertebral Bone Marrow and Paraspinal Muscle Composition Assessed Using MR-Based Proton Density Fat Fraction and T2* Maps in Patients with and without Osteoporosis
- PMID: 36292156
- PMCID: PMC9600908
- DOI: 10.3390/diagnostics12102467
Associations between Bone Mineral Density and Longitudinal Changes of Vertebral Bone Marrow and Paraspinal Muscle Composition Assessed Using MR-Based Proton Density Fat Fraction and T2* Maps in Patients with and without Osteoporosis
Abstract
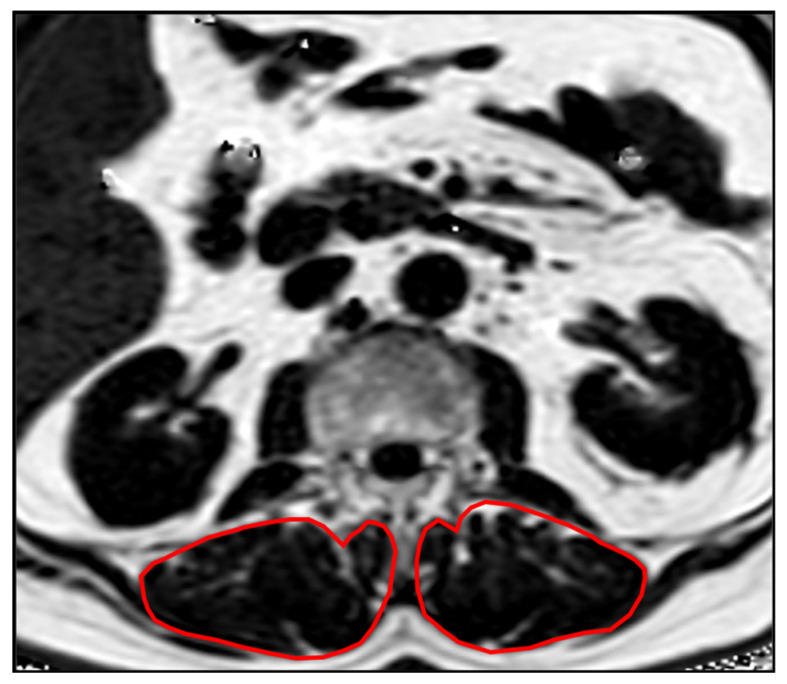
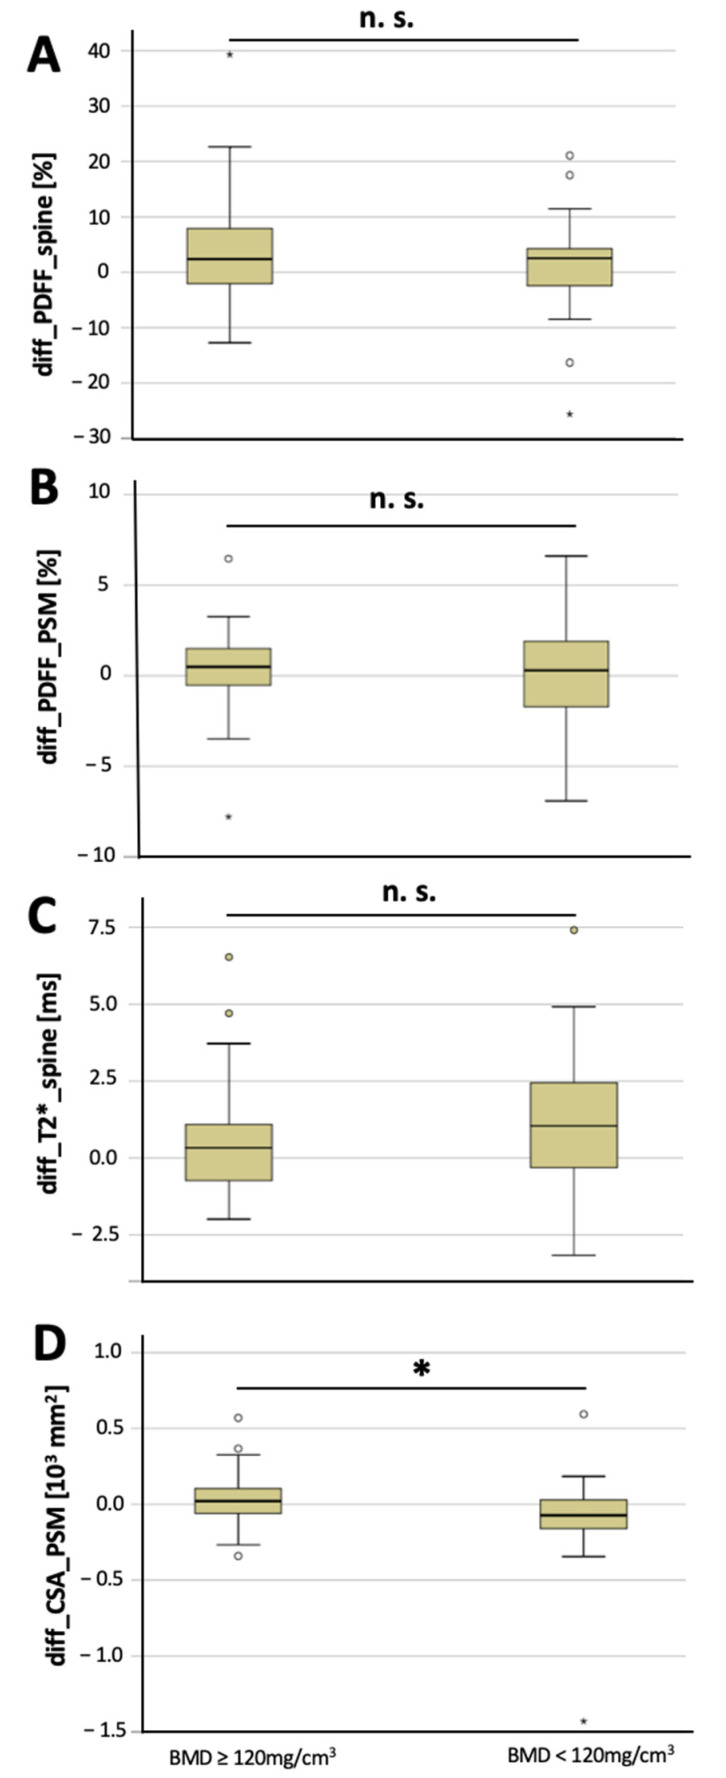
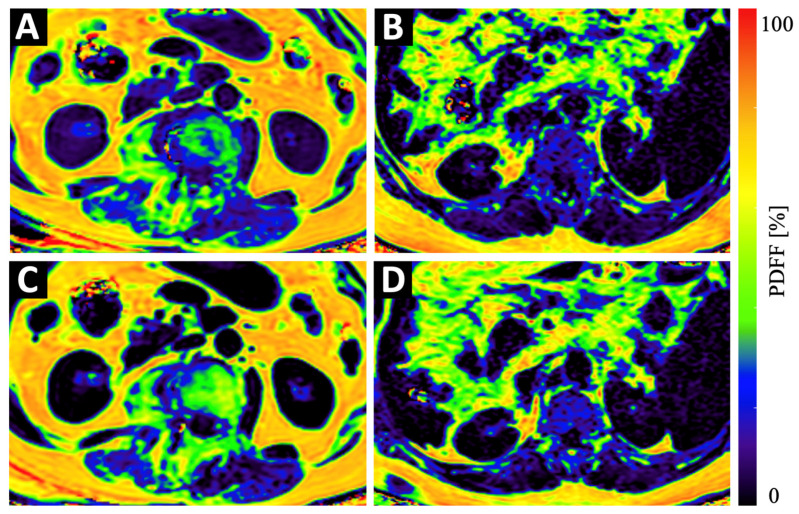
Background: Proton-density fat fraction (PDFF) and T2* of the vertebrae, as well as the cross-sectional area (CSA) of the paraspinal musculature (PSM), have been suggested as biomarkers for bone fragility. The aim of this study was to longitudinally assess changes in PDFF, T2* and CSA of the PSM over 6 months in patients with and without osteoporosis. Methods: Opportunistic bone mineral density (BMD) measurements (BMD < 120 mg/cm3) were obtained from a CT acquired during the clinical routine work up in osteoporotic/osteopenic patients (n = 29, mean age 72.37 ± 10.12 years, 16 women). These patients were frequency-matched for age and sex to subjects with normal BMD values (n = 29). All study patients underwent 3T MR imaging at baseline and 6-month follow up, including spoiled gradient echo sequences for chemical shift encoding-based water-fat separation, from which T2* and PDFF values of the lumbar spine and the PSM were obtained. Moreover, the CSA of the PSM was assessed longitudinally. Changes in T2*, PDFF and CSA over 6 months were calculated for the vertebrae and PSM and associations with baseline BMD values were assessed. Results: The change in CSA of the PSM over 6 months was significantly lower in the osteoporotic/osteopenic group (−91.5 ± 311.7 mm2), compared to the non-osteoporotic group, in which the CSA increased (29.9 ± 164.0 mm2, p = 0.03). In a further analysis, patients with higher vertebral PDFF at baseline showed a significantly stronger increase in vertebral T2*, compared to those patients with lower vertebral PDFF at baseline (0.9 ± 1.6 ms vs. 0.0 ± 1.8 ms, p = 0.04). Moreover, patients with higher PSM PDFF at baseline showed a significantly stronger increase in vertebral T2*, compared to those patients with lower PSM PDFF at baseline (0.9 ± 2.0 ms vs. 0.0 ± 1.3 ms, p = 0.03). Conclusion: The PSM CSA decreased significantly longitudinally in patients with osteoporosis/osteopenia, compared to those without. Additionally, higher vertebral and PSM PDFF at baseline were associated with stronger changes in vertebral bone marrow T2*. Therefore, longitudinal PDFF and T2* mapping may be useful quantitative radiation-free tools for the assessment and prediction of muscle and bone health in patients with suspected osteoporosis/osteopenia.
Keywords: bone marrow; magnetic resonance imaging; osteoporosis; spine.
Conflict of interest statement
The authors declare no conflict of interest.
Figures
References
-
- Beasley L.E., Koster A., Newman A.B., Javaid M.K., Ferrucci L., Kritchevsky S.B., Kuller L.H., Pahor M., Schaap L.A., Visser M., et al. Inflammation and race and gender differences in computerized tomography-measured adipose depots. Obesity. 2009;17:1062–1069. doi: 10.1038/oby.2008.627. - DOI - PMC - PubMed
LinkOut - more resources
Full Text Sources
Miscellaneous
