. 2022 Sep 23;13(10):1708.
doi: 10.3390/genes13101708.

Single Cell Sequencing Reveals Mechanisms of Persistent Truncus Arteriosus Formation after PDGFRα and PDGFRβ Double Knockout in Cardiac Neural Crest Cells

Affiliations

Single Cell Sequencing Reveals Mechanisms of Persistent Truncus Arteriosus Formation after PDGFRα and PDGFRβ Double Knockout in Cardiac Neural Crest Cells

Tianyun Chen et al. Genes (Basel). .

Abstract

Persistent truncus arteriosus (PTA) is an uncommon and complex congenital cardiac malformation accounting for about 1.2% of all congenital heart diseases (CHDs), which is caused by a deficiency in the embryonic heart outflow tract's (OFT) septation and remodeling. PDGFRα and PDGFRβ double knockout (DKO) in cardiac neural crest cells (CNCCs) has been reported to cause PTA, but the underlying mechanisms remain unclear. Here, we constructed a PTA mouse model with PDGFRα and PDGFRβ double knockout in Pax3+ CNCCs and described the condensation failure into OFT septum of CNCC-derived cells due to disturbance of cell polarity in the DKO group. In addition, we further explored the mechanism with single-cell RNA sequencing. We found that two main cell differentiation trajectories into vascular smooth muscle cells (VSMCs) from cardiomyocytes (CMs) and mesenchymal cells (MSs), respectively, were interrupted in the DKO group. The process of CM differentiation into VSMC stagnated in a transitional CM I-like state, which contributed to the failure of OFT remodeling and muscular septum formation. On the other hand, a Penk+ transitional MS II cluster closely related to cell condensation into the OFT septum disappeared, which led to the OFT's septation absence directly. In conclusion, the disturbance of CNCC-derived cells caused by PDGFRα and PDGFRβ knockout can lead to the OFT septation disorder and the occurrence of PTA.

Keywords: cardiac outflow tract; neural crest cells; persistent truncus arteriosus; platelet-derived growth factor receptor; single-cell RNA-seq.


Conflict of interest statement

The authors declare no conflict of interest.

Figures
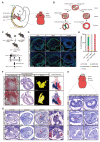
Figure 1
Figure 1
Animal model establishment and phenotypic identification. (A) Schematic representation showing that CNCCs (orange) have reached the heart region (red) in the E10.5 mouse embryo and then migrated through the distal-proximal axis of the OFT. (B) The schematic representation of OFT transverse sections shows that CNCC condensation and OFT separation occurred along the OFT distal-proximal axis, while these events disappeared in the separation disorder situation. (C) Target PDGFRα and PDGFRβ-conditional-knockout (Pax3cre/+; PDGFRαfl/fl; PDGFRβfl/fl) embryos were obtained by hybridization between Pax3cre/+; PDGFRαfl/+; PDGFRβfl/fl and PDGFRαfl/fl; PDGFRβfl/fl mice. Pax3-Cre was used to knockout PDGFRα and PDGFRβ in CNCCs specifically. (D) The efficiency of PDGFRα and PDGFRβ knockout in CNCCs by immunofluorescence shows that the expression of PDGFRα and PDGFRβ was lower in the OFT cushion region in the DKO group. n = 3 vs. 3. Scale bar, 50 µm. (E) Phenotypic statistics of PDGFRα/β single and DKO group at E17.5. n = 15 vs. 48. (F) The phenotypic confirmation at E17.5 with multiple methods (stereoscope, microscope, and 3D OFT reconstruction) showed that the embryos in the DKO group had a PTA phenotype. n = 15 vs. 48. Scale bar, 300 µm. (G) Timepoint confirmation of OFT separation. The cross-section of embryonic OFT showed that OFT separation had not occurred until E12.5. At E12.5, OFT started separation in the control group, while septum was not formed in the DKO group (red arrow). E11.5, n = 8 vs. 8; E12.0, n = 10 vs. 8; E12.5, n = 12 vs. 9; E14.5, n = 7 vs. 3. Scale bar, 50 µm. (H) The phenotypic confirmation on transverse sections across the OFT at three distinct distal-proximal levels in E12.5 embryos with the indicated genotype. n = 12 vs. 9. Scale bar, 50 µm. Pha, pharyngeal arch; V, ventricle; Pa, pulmonary trunk; Ao, aorta; TA, truncus arteriosus; OFT, outflow tract; DKO, double knockout; PTA, persistent truncus arteriosus; CNCCs, cardiac neural crest cells; *, septal bridge.
Figure 2
Figure 2
OFT cell polarity difference between DKO and control group. (A) The cellular polarity of OFT cells was examined with anti-GM130 (a marker for Golgi) and DAPI (a marker for nucleus). n = 4 vs. 4. Scale bar, 50 µm. (B) A clockwise angle between the vector from the center of the nucleus to the Golgi apparatus and the right-left axis (0–180°) was measured in individual OFT cushion cells. The percentage of cell numbers in each angle range was plotted on radar graphs, which showed a similar distribution pattern of data obtained from 4 embryos in each graph (marked with different colors). In the upper-left and lower-right cushion of the control group, the vector angle was frequently distributed at 120–150° and 300–330° (p < 0.01, v2 test), respectively, whereas the polarity of the vector angle was not significant in DKO group (p = 0.13, v2 test). OFT, outflow tract; DKO, double knockout.
Figure 3
Figure 3
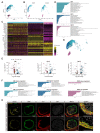
Single-cell transcriptome sequencing revealed a profile of cell cluster, lineage, and proportion. (A) Overview of the experimental procedure. Embryonic OFT was micro-dissected (red dotted line) under a stereoscope and built library by Chromium 10× for single-cell transcriptome sequencing. (B) Unsupervised clustering of aggregate OFT cells revealed 10 cell clusters projected on UMAP plots. (C) Dot plot showing expression of top up-regulated genes across OFT cell clusters. (D) Expression of select marker genes across OFT cells as visualized on UMAP plots (MSs: Postn; VSMCs: Cxcl12; CMs: Actc1; epicardial cells: Upk3b; and endothelial cells: Fabp5). (E) Cell population percentages of each cluster between DKO and control group. MS, mesenchymal cell; CM, cardiomyocyte; VSMC, vascular smooth muscle cell; EP, epicardial cell; EC: endothelial cell; CON, control; DKO, double knockout; UMAP, uniform manifold approximation and projection; OFT, outflow tract.
Figure 4
Figure 4
CM clusters and changes after PDGFRα and PDGFRβ knockout. (A) UMAP plot of all captured CM populations colored by cluster identity (CM I, II, and III). (B) Cell cluster distribution of the DKO and control group on UMAP plots revealed that there was a significant difference in the proportion of CM I and II between the DKO and control group. (C) Heatmap showing top 10 cluster-specific genes for each CM subcluster. (D) Functional enrichment of genes significantly expressed in CM I, II, and III. (E) DEGs of CM I, II, and III between DKO and control group. (F) Functional enrichment of genes significantly up-regulated and down-regulated in CM I, II, and III between the DKO and control group. (G) Direction and rate of cellular state changes inferred by RNA velocity analysis between CM clusters. (H) In vivo immunofluorescence verification experiment using CM marker cTnT, VSMC marker α-SMA, and CM I cluster specific marker Sema3c showed that CM I existed and was mainly distributed on the pulmonary artery side. n = 5 vs. 5. Scale bar, 50 µm. UMAP, uniform manifold approximation and projection; DEG, differentially expressed genes; CON, control; DKO, double knockout; MS, mesenchymal cell; CM, cardiomyocyte; VSMC, vascular smooth muscle cell; EP, epicardial cell; EC: endothelial cell; OFT, outflow tract; Pa, pulmonary trunk; Ao, aorta; Sep, septal bridge.
Figure 5
Figure 5
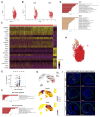
MS clusters and changes after PDGFRα and PDGFRβ knockout. (A) UMAP plot of all captured MS populations colored by cluster identity (MS I and II). (B) Cell cluster distribution of the DKO and control group on UMAP plots revealed that cluster MS II was absent in the DKO group. (C) Heatmap showing DEGs between MS I and II. (D) Functional enrichment of genes significantly up-regulated in MS I and II. (E) DEGs of MS I after PDGFRα and PDGFRβ DKO. (F) Functional enrichment of genes significantly up-regulated and down-regulated in MS I between the DKO and control group. (G) Sema3c and Penk were both highly expressed on MS II, indicating that MS II represented the MSs of the septal bridge in OFT. (H) Direction and rate of cellular state changes inferred by RNA velocity analysis. (I) Penk+ and Sema3c+ MS II cluster cell absence in the middle of OFT cushions after PDGFRα and PDGFRβ knockout was confirmed by single-molecule fluorescent in situ hybridization. n = 3 vs. 3. Scale bar, 50 µm. UMAP, uniform manifold approximation and projection; DEG, differentially expressed genes; CON, control; DKO, double knockout; MS, mesenchymal cell; OFT, outflow tract.
Figure 6
Figure 6
VSMC changes after PDGFRα and PDGFRβ knockout. (A) UMAP plot of all captured VSMC populations colored by cluster identity (VSMC I and II). (B) Cell cluster distribution of the DKO and control group on UMAP plots. (C) The proportion of VSMC I and II cells between the DKO and control group. (D) Heatmap showing DEGs among VSMC subgroups. (E) Expression of marker genes across VSMC clusters as visualized on UMAP plots (VSMC I: Col1a2 and Fbn1; VSMC II: Tmsb10 and Tmsb4x). (F) Functional enrichment of genes significantly up-regulated in VSMC I and II. (G) DEGs of VSMC I and II after PDGFRα and PDGFRβ DKO. (H) Functional enrichment of genes significantly up-regulated and down-regulated in VSMC I and II between the DKO and control group. UMAP, uniform manifold approximation and projection; DEG, differentially expressed genes; CON, control; DKO, double knockout; VSMC, vascular smooth muscle cell.

Similar articles

Cited by

References

    1. Srivastava D. Making or Breaking the Heart: From Lineage Determination to Morphogenesis. Cell. 2006;126:1037–1048. doi: 10.1016/j.cell.2006.09.003. - DOI - PubMed
    1. Slavik Z., Keeton B.R., Salmon A.P., Sutherland G.R., Fong L.V., Monro J.L. Persistent truncus arteriosus operated during infancy: Long-term follow-up. Pediatr. Cardiol. 1994;15:112–115. doi: 10.1007/BF00796321. - DOI - PubMed
    1. Pearl J.M., Laks H., Drinkwater D.C., Milgalter E., Charas O.A., Giacobetti F., George B., Williams R. Repair of truncus arteriosus in infancy. Ann. Thorac. Surg. 1991;52:780–786. doi: 10.1016/0003-4975(91)91211-D. - DOI - PubMed
    1. Nichols D.G., Ungerleider R.M., Spevak P.J. Critical Heart Disease in Infants and Children (Second Edition) Mosby; Philadelphia, PA, USA: 2006. pp. 995–1024.
    1. Rajasinghe H.A., McElhinney D.B., Reddy V., Mora B.N., Hanley F.L. Long-term follow-up of truncus arteriosus repaired in infancy: A twenty-year experience. J. Thorac. Cardiovasc. Surg. 1997;113:869–879. doi: 10.1016/S0022-5223(97)70259-9. - DOI - PubMed

Publication types

Substances

LinkOut - more resources