

A Novel Strategy for Constructing an Integrated Linkage Map in an F1 Hybrid Population of Populus deltoides and Populus simonii
- PMID: 36292616
- PMCID: PMC9601732
- DOI: 10.3390/genes13101731
A Novel Strategy for Constructing an Integrated Linkage Map in an F1 Hybrid Population of Populus deltoides and Populus simonii
Abstract
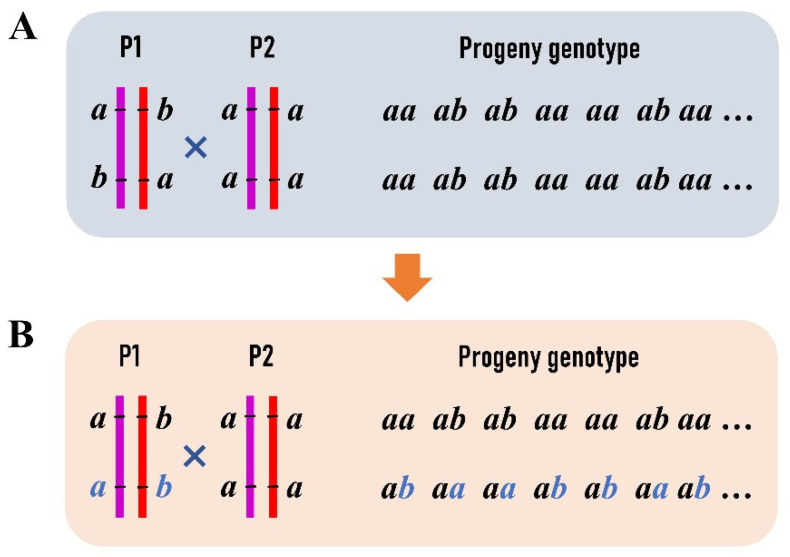
The genetic linkage maps of the traditional F2 population in inbred lines were estimated from the frequency of recombination events in both parents, providing full genetic information for genetic and genomic studies. However, in outbred forest trees, it is almost impossible to generate the F2 population because of their high heterozygosity and long generation times. We proposed a novel strategy to construct an integrated genetic linkage map that contained both parental recombination information, with restriction-site-associated DNA sequencing (RADSeq) data in an F1 hybrid population of Populus deltoides and Populus simonii. We selected a large number of specific RAD tags to construct the linkage map, each of which contained two SNPs, one heterozygous only in the female parent and the other heterozygous only in the male. Consequently, the integrated map contained a total of 1154 RAD tags and 19 linkage groups, with a total length of 5255.49 cM and an average genetic distance of 4.63 cM. Meanwhile, the two parent-specific linkage maps were also constructed with SNPs that were heterozygous in one parent and homozygous in the other. We found that the integrated linkage map was more consensus with the genomic sequences of P. simonii and P. deltoides. Additionally, the likelihood of the marker order in each linkage group of the integrated map was greater than that in both parental maps. The integrated linkage map was more accurate than the parent-specific linkage maps constructed in the same F1 hybrid population, providing a powerful genetic resource for identifying the quantitative trait loci (QTLs) with dominant effects, assembling genomic sequences, and performing comparative genomics in related Populus species. More importantly, this novel strategy can be used in other outbred species to build an integrated linkage map.
Keywords: F1 hybrid population; Populus; genetic linkage map; next-generation sequencing; outbred species.
Conflict of interest statement
The authors declare no conflict of interest. The funders had no role in the design of the study; in the collection, analyses, or interpretation of data; in the writing of the manuscript; or in the decision to publish the results.
Figures


References
Publication types
MeSH terms
LinkOut - more resources
Full Text Sources
Miscellaneous
