

Identification and Analysis of Immune-Related Gene Signature in Hepatocellular Carcinoma
- PMID: 36292719
- PMCID: PMC9601963
- DOI: 10.3390/genes13101834
Identification and Analysis of Immune-Related Gene Signature in Hepatocellular Carcinoma
Abstract
Background: Hepatocellular carcinoma (HCC) originates from the hepatocytes and accounts for 90% of liver cancer. The study intends to identify novel prognostic biomarkers for predicting the prognosis of HCC patients based on TCGA and GSE14520 cohorts.
Methods: Differential analysis was employed to obtain the DEGs (Differentially Expressed Genes) of the TCGA-LIHC-TPM cohort. The lasso regression analysis was applied to build the prognosis model through using the TCGA cohort as the training group and the GSE14520 cohort as the testing group. Next, based on the prognosis model, we performed the following analyses: the survival analysis, the independent prognosis analysis, the clinical feature analysis, the mutation analysis, the immune cell infiltration analysis, the tumor microenvironment analysis, and the drug sensitivity analysis. Finally, the survival time of HCC patients was predicted by constructing nomograms.
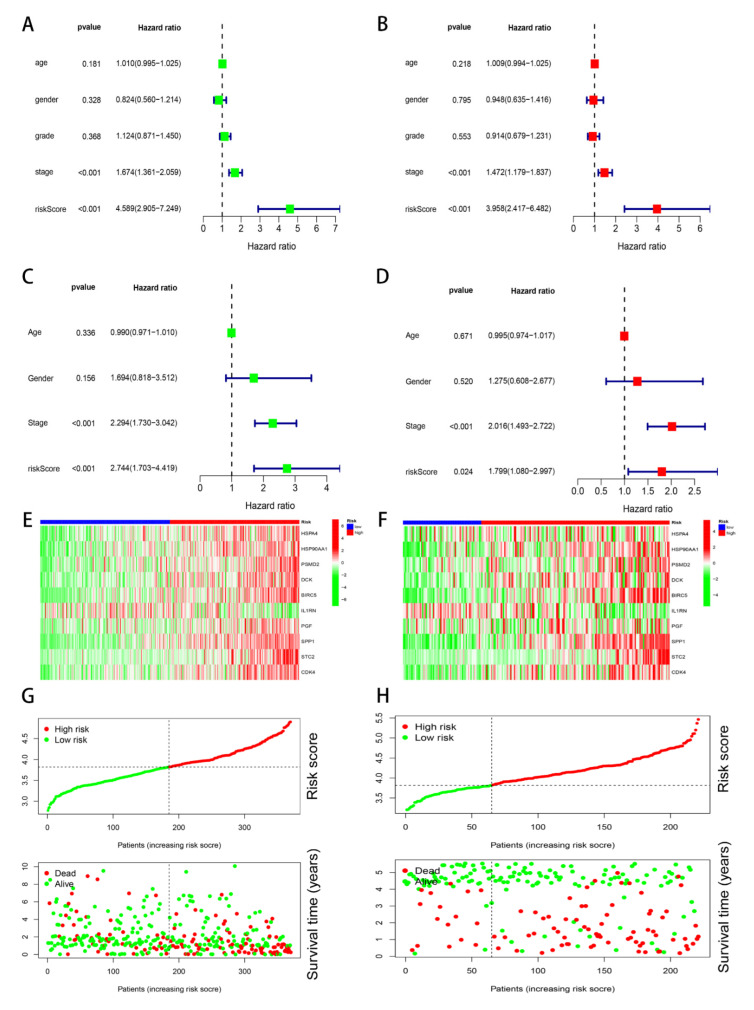
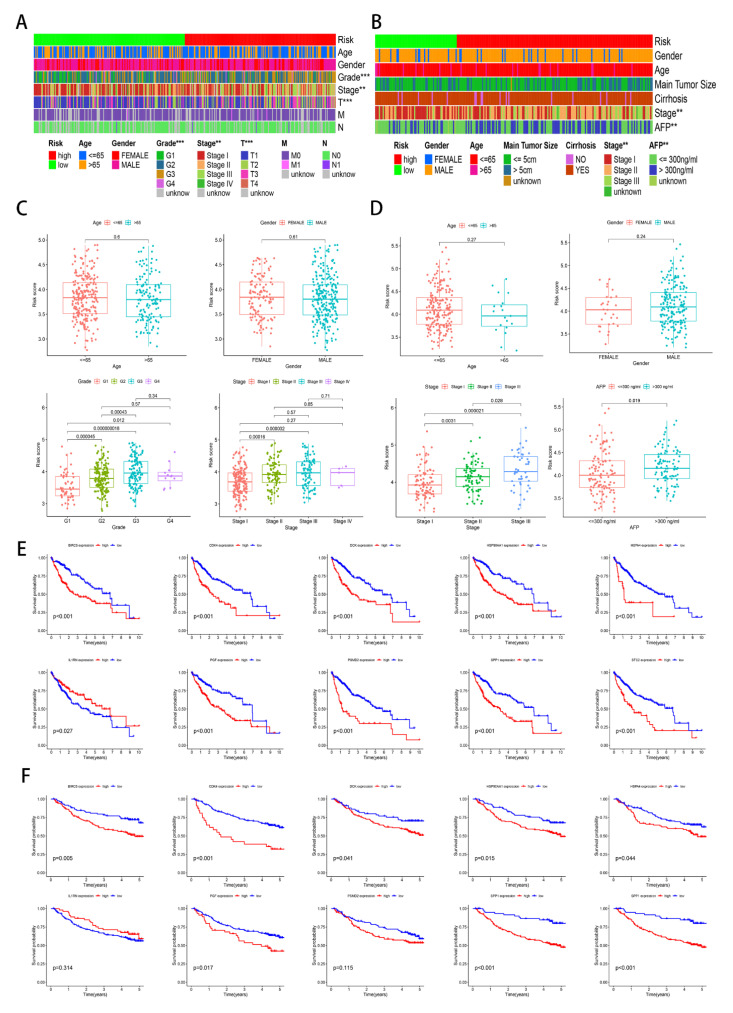
Results: Through the lasso regression analysis, we obtained a prognosis model of ten genes including BIRC5 (baculoviral IAP repeat containing 5), CDK4 (cyclin-dependent kinase 4), DCK (deoxycytidine kinase), HSPA4 (heat shock protein family A member 4), HSP90AA1 (heat shock protein 90 α family class A member 1), PSMD2 (Proteasome 26S Subunit Ubiquitin Receptor, Non-ATPase 2), IL1RN (interleukin 1 receptor antagonist), PGF (placental growth factor), SPP1 (secreted phosphoprotein 1), and STC2 (stanniocalcin 2). First, we found that the risk score is an independent prognosis factor and is related to the clinical features of HCC patients, covering AFP (α-fetoprotein) and stage. Second, we observed that the p53 mutation was the most obvious mutation between the high-risk and low-risk groups. Third, we also discovered that the risk score is related to some immune cells, covering B cells, T cells, dendritic, macrophages, neutrophils, etc. Fourth, the high-risk group possesses a lower TIDE score, a higher expression of immune checkpoints, and higher ESTIMATE score. Finally, nomograms include the clinical features and risk signatures, displaying the clinical utility of the signature in the survival prediction of HCC patients.
Conclusions: Through the comprehensive analysis, we constructed an immune-related prognosis model to predict the survival of HCC patients. In addition to predicting the survival time of HCC patients, this model significantly correlates with the tumor microenvironment. Furthermore, we concluded that these ten immune-related genes (BIRC5, CDK4, DCK, HSPA4, HSP90AA1, PSMD2, IL1RN, PGF, SPP1, and STC2) serve as novel targets for antitumor immunity. Therefore, this study plays a significant role in exploring the clinical application of immune-related genes.
Keywords: clinical; hepatocellular carcinoma; immune; mutation; prognosis.
Conflict of interest statement
The authors declare no conflict of interest.
Figures


Similar articles
-
Identification and validation of redox-immune based prognostic signature for hepatocellular carcinoma.Int J Med Sci. 2021 Mar 10;18(9):2030-2041. doi: 10.7150/ijms.56289. eCollection 2021. Int J Med Sci. 2021. PMID: 33850474 Free PMC article.
-
A novel five-gene signature predicts overall survival of patients with hepatocellular carcinoma.Cancer Med. 2021 Jun;10(11):3808-3821. doi: 10.1002/cam4.3900. Epub 2021 May 2. Cancer Med. 2021. PMID: 33934539 Free PMC article.
-
Pyroptosis related genes signature predicts prognosis and immune infiltration of tumor microenvironment in hepatocellular carcinoma.BMC Cancer. 2022 Sep 20;22(1):999. doi: 10.1186/s12885-022-10097-2. BMC Cancer. 2022. PMID: 36127654 Free PMC article.
-
Identification of molecular subtypes and prognostic signatures based on transient receptor potential channel-related genes to predict the prognostic risk of hepatocellular carcinoma: A review.Medicine (Baltimore). 2023 Mar 10;102(10):e33228. doi: 10.1097/MD.0000000000033228. Medicine (Baltimore). 2023. PMID: 36897679 Free PMC article. Review.
-
Unleashing the potential of gene signatures as prognostic and predictive tools: A step closer to personalized medicine in hepatocellular carcinoma (HCC).Cell Biochem Funct. 2024 Jan;42(1):e3913. doi: 10.1002/cbf.3913. Cell Biochem Funct. 2024. PMID: 38269520 Review.
Cited by
-
Identification and validation of MMP1 as a biomarker associated with mitochondrial oxidative stress in liver hepatocellular carcinoma.Sci Rep. 2025 Jul 7;15(1):24276. doi: 10.1038/s41598-025-10076-0. Sci Rep. 2025. PMID: 40624187 Free PMC article.
-
Heme Metabolism-Related Gene TENT5C is a Prognostic Marker and Investigating Its Immunological Role in Colon Cancer.Pharmgenomics Pers Med. 2023 Dec 23;16:1127-1143. doi: 10.2147/PGPM.S433790. eCollection 2023. Pharmgenomics Pers Med. 2023. PMID: 38152411 Free PMC article.
-
Identification of oncogenes and tumor-suppressor genes with hepatocellular carcinoma: A comprehensive analysis based on TCGA and GEO datasets.Front Genet. 2023 Jan 4;13:934883. doi: 10.3389/fgene.2022.934883. eCollection 2022. Front Genet. 2023. PMID: 36685860 Free PMC article.
-
Predictive three-biomarker panel in peripheral blood mononuclear cells for detecting hepatocellular carcinoma.Sci Rep. 2024 Mar 29;14(1):7527. doi: 10.1038/s41598-024-58158-9. Sci Rep. 2024. PMID: 38553531 Free PMC article.
-
A programmed cell death-related gene signature to predict prognosis and therapeutic responses in liver hepatocellular carcinoma.Discov Oncol. 2024 Mar 11;15(1):71. doi: 10.1007/s12672-024-00924-2. Discov Oncol. 2024. PMID: 38466483 Free PMC article.
References
-
- Cabibbo G., Maida M.F., Genco C., Alessi N., Peralta M., Butera G., Galia M., Brancatelli G., Genova C., Raineri M., et al. Survival of Patients with Hepatocellular Carcinoma (HCC) Treated by Percutaneous Radio-Frequency Ablation (RFA) Is Affected by Complete Radiological Response. PLoS ONE. 2013;8:e70016. doi: 10.1371/journal.pone.0070016. - DOI - PMC - PubMed
Publication types
MeSH terms
Substances
LinkOut - more resources
Full Text Sources
Medical
Research Materials
Miscellaneous
