

A Novel Identified Necroptosis-Related Risk Signature for Prognosis Prediction and Immune Infiltration Indication in Acute Myeloid Leukemia Patients
- PMID: 36292722
- PMCID: PMC9602382
- DOI: 10.3390/genes13101837
A Novel Identified Necroptosis-Related Risk Signature for Prognosis Prediction and Immune Infiltration Indication in Acute Myeloid Leukemia Patients
Abstract
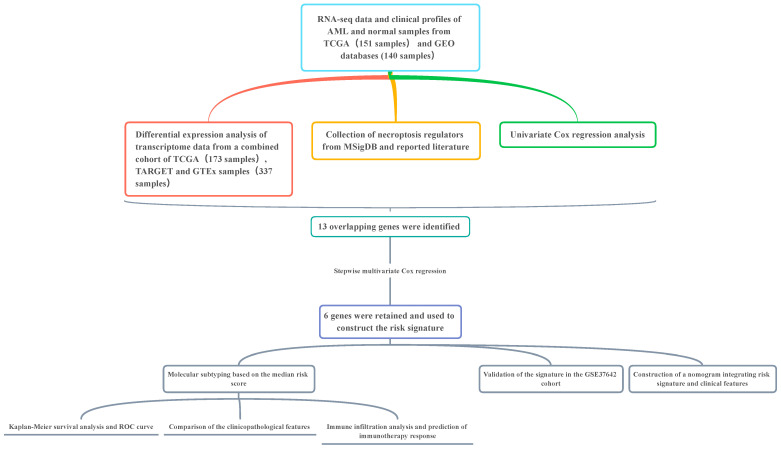
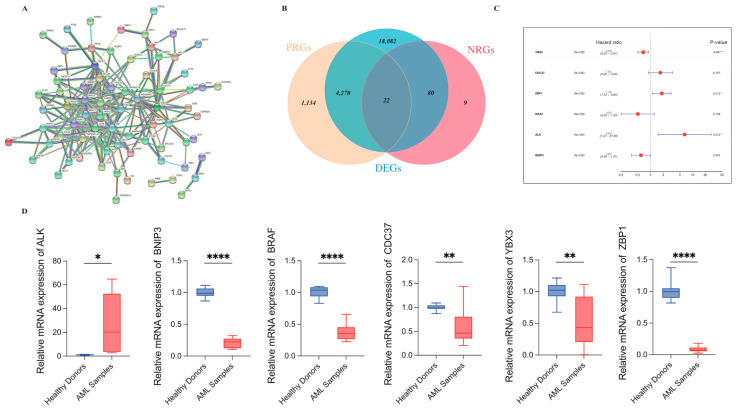
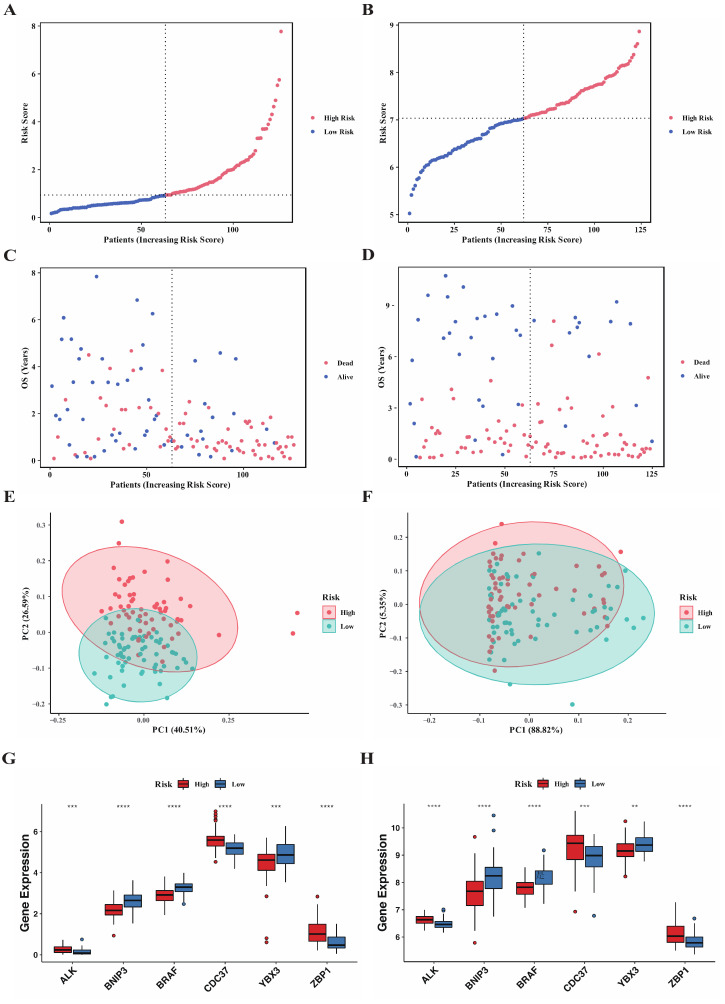
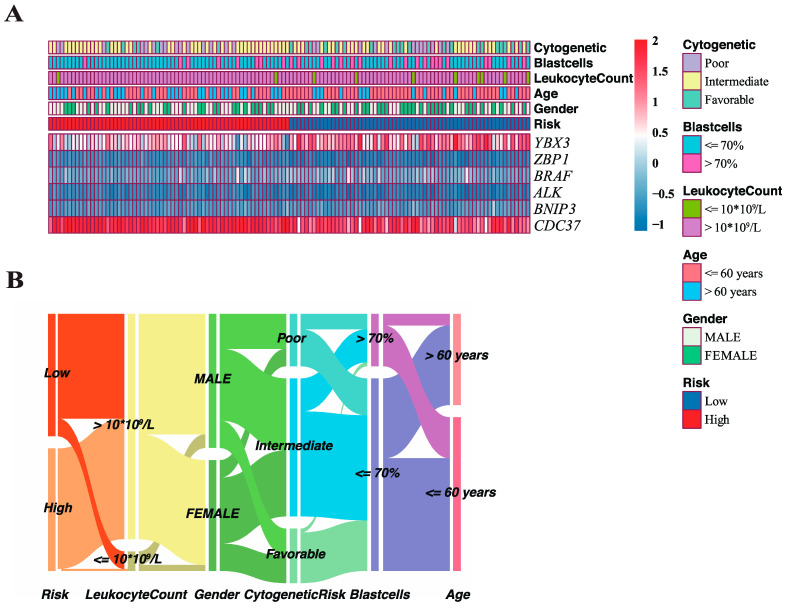
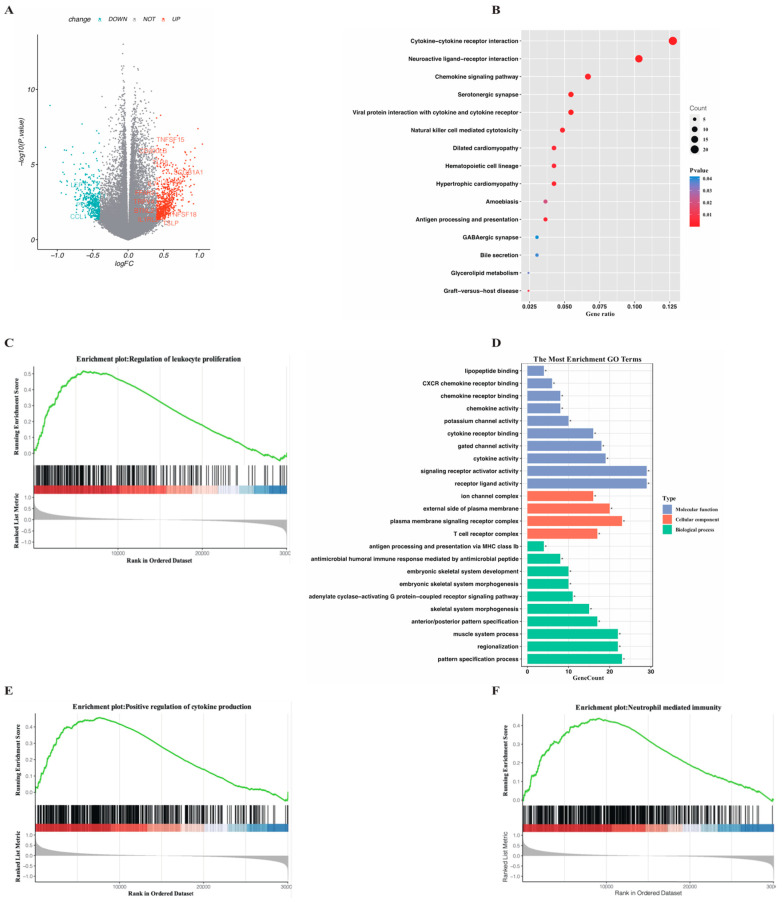
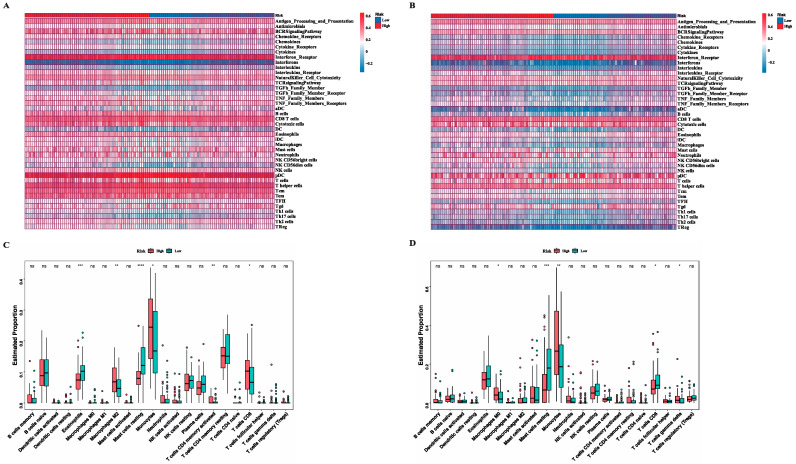
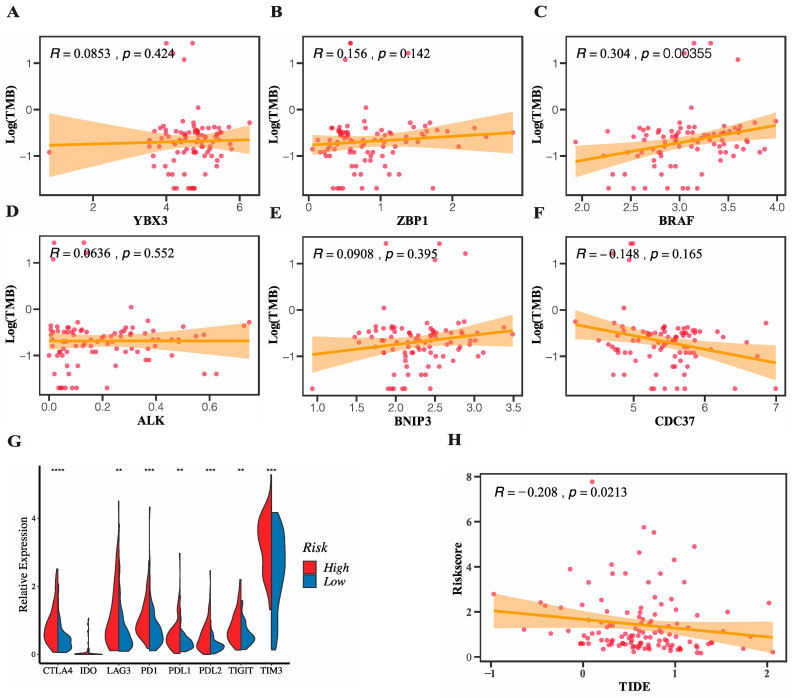
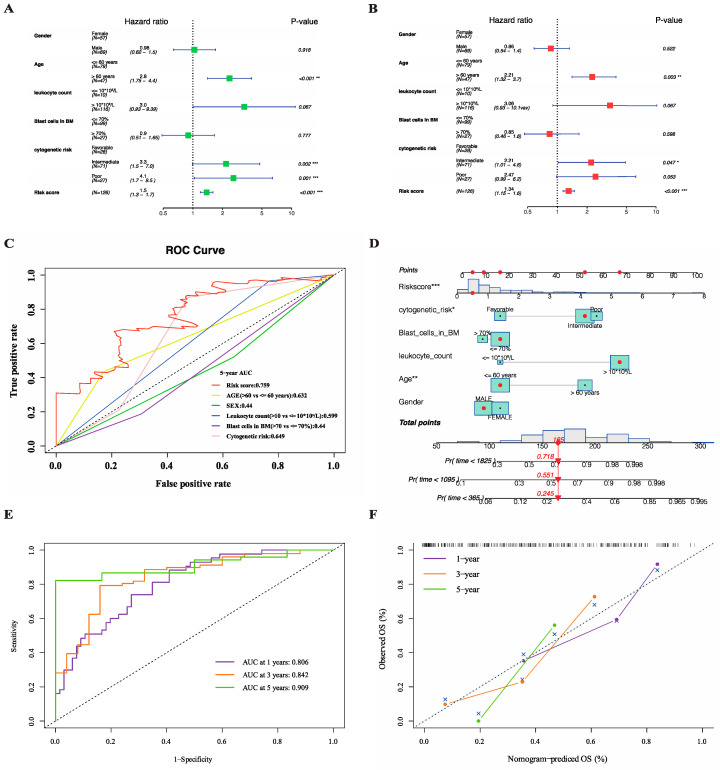
AML ranks second in the most common types of leukemia diagnosed in both adults and children. Necroptosis is a programmed inflammatory cell death form reported to be an innate immune effector against microbial and viral pathogens and recently has been found to play an eventful role in the oncogenesis, progression, and metastasis of cancer. This study is designed to explore the potential value of necroptosis in predicting prognostic and optimizing the current therapeutic strategies for AML patients. We collected transcriptome and clinical data from the Cancer Genome Atlas (TCGA) and the Genotype-Tissue Expression (GTEx) databases and selected necroptosis-related genes with both differential significance and prognostic value. Six genes (YBX3, ZBP1, CDC37, ALK, BRAF, and BNIP3) were incorporated to generate a risk model with the implementation of multivariate Cox regression. The signature was proven to be an independent prognostic predictor in both training and validation cohorts with hazard ratios (HRs) of 1.51 (95% CI: 1.33-1.72) and 1.57 (95% CI: 1.16-2.12), respectively. Moreover, receiver operating characteristic (ROC) curve was utilized to quantify the predictive performance of the signature and satisfying results were shown with the area under the curve (AUC) up to 0.801 (3-year) and 0.619 (3-year), respectively. In addition, the subtyping of AML patients based on the risk signature demonstrated a significant correlation with the immune cell infiltration and response to immunotherapy. Finally, we incorporated risk signature with the classical clinical features to establish a nomogram which may contribute to the improvement of clinical management. To conclude, this study identified a necroptosis-related signature as a novel biomarker to improve the risk stratification, to inform the immunotherapy efficacy, and to indicate the therapeutic option of targeted therapy.
Keywords: acute myeloid leukemia; immune infiltration; multivariate Cox regression; necroptosis; prognostic model.
Conflict of interest statement
The authors declare no conflict of interest.
Figures

Similar articles
-
Identification and validation of necroptosis-related gene signatures to predict clinical outcomes and therapeutic responses in acute myeloid leukemia.Aging (Albany NY). 2023 Nov 21;15(24):14677-14702. doi: 10.18632/aging.205231. Epub 2023 Nov 21. Aging (Albany NY). 2023. PMID: 37993258 Free PMC article.
-
A novel necroptosis-related gene signature in acute myeloid leukemia.Hematology. 2023 Dec;28(1):2227491. doi: 10.1080/16078454.2023.2227491. Hematology. 2023. PMID: 37367830
-
Construction and validation of a necroptosis-related prognostic signature in acute myeloid leukemia.Medicine (Baltimore). 2024 May 31;103(22):e38432. doi: 10.1097/MD.0000000000038432. Medicine (Baltimore). 2024. PMID: 39259061 Free PMC article.
-
Identification and validation of necroptosis-related prognostic gene signature and tumor immune microenvironment infiltration characterization in esophageal carcinoma.BMC Gastroenterol. 2022 Jul 15;22(1):344. doi: 10.1186/s12876-022-02423-6. BMC Gastroenterol. 2022. PMID: 35840882 Free PMC article.
-
A novel necroptosis-related gene index for predicting prognosis and a cold tumor immune microenvironment in stomach adenocarcinoma.Front Immunol. 2022 Oct 27;13:968165. doi: 10.3389/fimmu.2022.968165. eCollection 2022. Front Immunol. 2022. PMID: 36389725 Free PMC article. Review.
Cited by
-
Characterization of ligand-receptor pair in acute myeloid leukemia: a scoring model for prognosis, therapeutic response, and T cell dysfunction.Front Oncol. 2024 Oct 17;14:1473048. doi: 10.3389/fonc.2024.1473048. eCollection 2024. Front Oncol. 2024. PMID: 39484036 Free PMC article.
-
Vacuolar ATPase Is a Possible Therapeutic Target in Acute Myeloid Leukemia: Focus on Patient Heterogeneity and Treatment Toxicity.J Clin Med. 2023 Aug 25;12(17):5546. doi: 10.3390/jcm12175546. J Clin Med. 2023. PMID: 37685612 Free PMC article.
-
Identification and validation of necroptosis-related gene signatures to predict clinical outcomes and therapeutic responses in acute myeloid leukemia.Aging (Albany NY). 2023 Nov 21;15(24):14677-14702. doi: 10.18632/aging.205231. Epub 2023 Nov 21. Aging (Albany NY). 2023. PMID: 37993258 Free PMC article.
-
Probing the Potential of Defense Response-Associated Genes for Predicting the Progression, Prognosis, and Immune Microenvironment of Osteosarcoma.Cancers (Basel). 2023 Apr 21;15(8):2405. doi: 10.3390/cancers15082405. Cancers (Basel). 2023. PMID: 37190333 Free PMC article.
-
Machine learning-based biomarker screening for acute myeloid leukemia prognosis and therapy from diverse cell-death patterns.Sci Rep. 2024 Aug 2;14(1):17874. doi: 10.1038/s41598-024-68755-3. Sci Rep. 2024. PMID: 39090256 Free PMC article.
References
Publication types
MeSH terms
Substances
LinkOut - more resources
Full Text Sources
Medical
Research Materials
Miscellaneous
