. 2022 Oct 12;23(20):12132.
doi: 10.3390/ijms232012132.

LncGSAR Controls Ovarian Granulosa Cell Steroidogenesis via Sponging MiR-125b to Activate SCAP/SREBP Pathway

Affiliations

LncGSAR Controls Ovarian Granulosa Cell Steroidogenesis via Sponging MiR-125b to Activate SCAP/SREBP Pathway

Yong Wang et al. Int J Mol Sci. .

Abstract

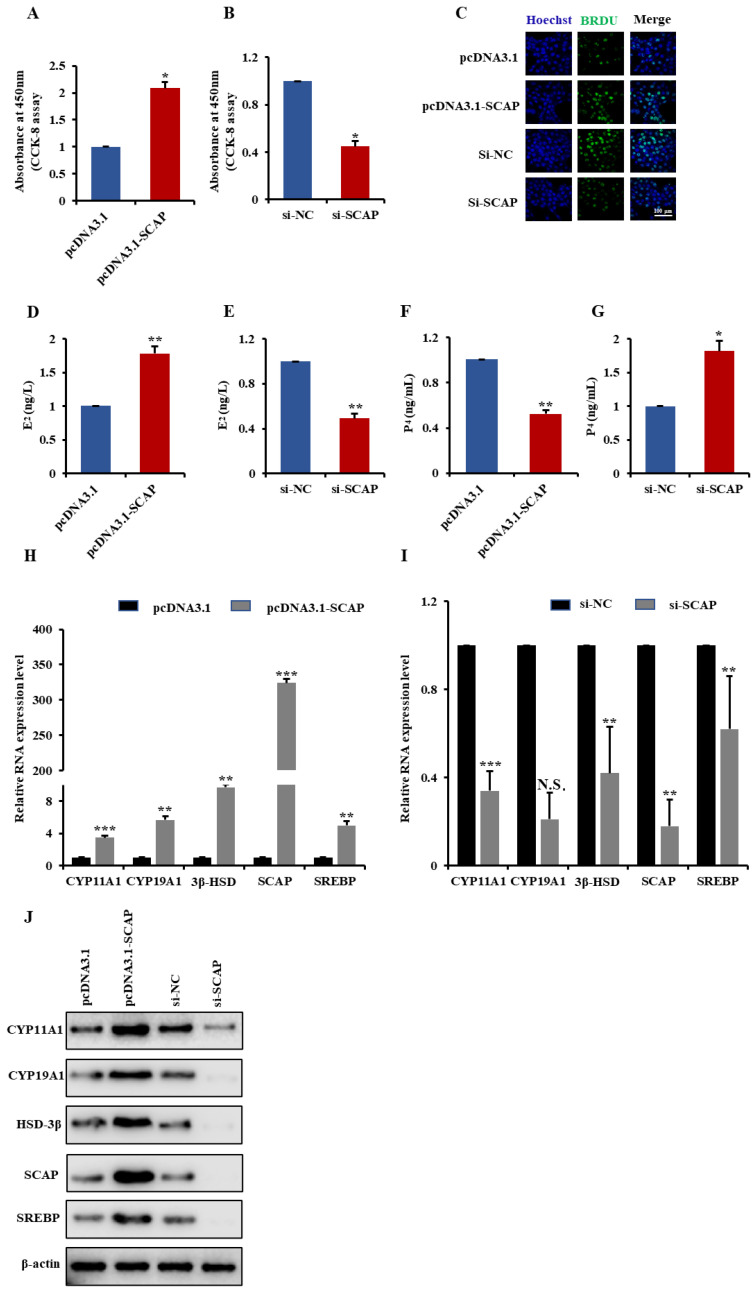
Long non-coding RNAs (lncRNAs) have been shown to play important roles in livestock fecundity, and many lncRNAs that affect follicular development and reproductive diseases have been identified in the ovary. However, only a few of them have been functionally annotated and mechanistically validated. In this study, we identified a new lncRNA (lncGSAR) and investigated its effects on the proliferation and steroidogenesis of ovine granulosa cells (GCs). High concentrations of glucose (add 33.6 mM glucose) caused high expression of lncGSAR in GCs by regulating its stability, and lncGSAR overexpression promoted GCs proliferation, estrogen secretion, and inhibited progesterone secretion, whereas interference with lncGASR had the opposite effect. Next, we found that the RNA molecules of lncGSAR act on MiR-125b as competitive endogenous RNA (ceRNA), and SREBP-cleavage-activating protein (SCAP) was verified as a target of MiR-125b. LncGASR overexpression increased the expression of SCAP, SREBP, and steroid hormone-related proteins, which can be attenuated by MiR-125b. Our results demonstrated that lncGSAR can act as a ceRNA to activate SCAP/SREBP signaling by sponging MiR-125b to regulate steroid hormone secretion in GCs. These findings provide new insights into the mechanisms of nutrient-regulated follicle development in ewes.

Keywords: MiR-125b; ceRNA; granulosa cell; lncGSAR; steroidogenesis.


Conflict of interest statement

The authors declare no conflict of interest.

Figures

Figure 1
Figure 1
LncRNA-miRNA-mRNA interaction network. (AC) Heatmap of long non-coding RNAs (lncRNAs) (A), microRNA (miRNA) (B), and mRNAs (C) showing hierarchical clustering of changed lncRNAs, miRNA, and mRNAs of granulosa cells (GCs) in different glucose treatment groups; up- and downregulated genes are colored in red and blue, respectively. (D) Quantitative real-time PCR (qRT-PCR) validations and RNA sequencing (RNA-seq) of lncGSAR in GCs from in different glucose treatment groups. (E) LncGSAR is localized in the cytoplasm and nucleus. GAPDH and U6 serve as cytoplasmic and nuclear localization controls, respectively. (F) LncRNA-miRNA-mRNA interaction network consists of one lncRNA (red circle), one miRNA (green arrow), and nine mRNAs (blue squares). Values represent means ± SEM for three individuals. * p < 0.05 and ** p < 0.01.
Figure 2
Figure 2
LncGSAR is transactivated upon glucose stimulation. (A) The GCs were treated with actinomycin D to explore the effect of glucose on the expression of lncGSAR. (B) Dual-luciferase reporter assay was conducted of lncGSAR promoter sequence and full-length sequence. (C) Dual-luciferase reporter for the lncGSAR promoter. (D) Detection of lncGSAR full-length luciferase activity. Values represent means ± SEM for three individuals. ** p < 0.01. N.S., not significant.
Figure 3
Figure 3
LncGSAR promotes GCs steroidogenesis and proliferation. (A,B) CCK-8 assay was performed to assess the effect of lncGSAR overexpression and knockdown on GCs proliferation. (C) The 5′-bromo-2′-deoxyuridine (BrdU) analysis after transfection of pcDNA3.1-lncGSAR and pcDNA3.1 empty plasmids, i.e., si-lncGSAR and si-NC, in proliferating GCs; scale bars are 100 µm. (D,E) Determination of estradiol (E2) concentrations in GCs transfected with pcDNA3.1-lncGSAR and pcDNA3.1 empty plasmids, i.e., si-lncGSAR and si-NC. (F,G) The progesterone (P4) concentrations in GCs after transfection of pcDNA3.1-lncGSAR and pcDNA3.1 empty plasmids or si-lncGSAR and si-NC. (H,I) The qRT-PCR of relative expression levels of steroidogenesis-related (CYP11A1, CYP19A1, and 3β-HSD) and sterol regulation-related (SCAP and SREBP) mRNAs in GCs transfected with pcDNA3.1-lncGSAR and in GCs transfected with si-lncGSAR. (J) Overexpression and knockdown of lncGSAR affected the expression of steroidogenesis-related proteins and sterol regulatory element proteins. Values represent means ± SEM for three individuals. ** p < 0.01; *** p < 0.001.
Figure 4
Figure 4
LncGSAR functions as a competing endogenous RNAs for MiR-125b. (A) The qRT-PCR validations and RNA-seq of MiR-125b in GCs from in different glucose treatment groups. (B) Pearson’s correlation was determined between lncGSAR and MiR-125b. (C,D) The expression levels of lncGSAR (C) and MiR-125b (D) in GCs after transfection of 0, 300, 500, or 800 ng of MiR-125b mimics. (E) Detection of lncGSAR expression levels after transfection of MiR-125b mimics or MiR-125b inhibitor. (F) Detection of lncGSAR expression levels after transfection of MiR-125b mimics in different glucose concentrations groups. (G) Schematic depicting the interactions of MiR-125b with wild-type lncGSAR (blue) and mutant lncGSAR (green). Red nucleotides indicate the seed sequence of MiR-125b. (H) The regulatory relationship between lncGSAR and MiR-125b was assessed using a dual-luciferase reporter gene assay. (I) The interaction of lncGSAR with MiR-125b was determined by RNA-RNA interaction pull-down assay. Values represent means ± SEM for three individuals. * p < 0.05; ** p < 0.01. N.S., not significant.
Figure 5
Figure 5
MiR-125b inhibit GCs steroidogenesis and proliferation. (A) The cell counting kit-8 (CCK-8) assay of GCs at 48 h after transfection of MiR-125b mimics and MiR-NC. (B) BrdU analysis was performed to assess the effect of MiR-125b overexpression on GCs proliferation. (CH) Cell cycle analysis of GCs at 48 h after transfection of MiR-125b mimics plasmid. (I) Determination of E2 concentrations after 48 h of GCs transfected with MiR-125b mimics. (J) Determination of P4 concentrations after 48 h of GCs transfected with MiR-125b mimics. (K) The qRT-PCR of relative expression levels of steroidogenesis-related (CYP11A1, CYP19A1, and 3β-HSD) and sterol regulation-related (SCAP and SREBP) mRNAs in GCs transfected with MiR-125b mimics. (L) Overexpression of MiR-125b affected the expression of steroidogenesis-related proteins and sterol regulatory element proteins. Values represent means ± SEM for three individuals. * p < 0.05; ** p < 0.01. N.S., not significant.
Figure 6
Figure 6
MiR-125b regulates GCs proliferation and steroidogenesis and by targeting SCAP-SREBP axis. (A) The qRT-PCR validations and RNA-seq of SCAP in GCs from in different glucose treatment groups. (B) Pearson’s correlation was determined between SCAP and MiR-125b. (C) MiR-125b or pcDNA3.1-lncGSAR and MiR-125 mimics were co-transfected into GCs for CCK-8 assay. (D,E) The concentrations of E2 and P4 determination in GCs transfected with MiR-125b mimics, i.e., pcDNA3.1-lncSCAP and MiR-125 mimics. (F) CCK-8 assay of GCs at 48 h after transfection of MiR-125b mimics plasmid or pcDNA3.1-lncSREBP and MiR-125 mimics. (G,H) The concentrations of E2 and P4 determination in GCs transfected with MiR-125b mimics, i.e., pcDNA3.1-lncSREBP and MiR-125 mimics. (I,J) Western blot detection of SCAP (I) and SREBP (J) in GCs after overexpression of MiR-125b. (K) Schematic depicting the interaction of MiR-125b with wild-type (blue) and mutant SCAP (green). Red nucleotides indicate the seed sequence of MiR-125b. (L) The regulatory relationship between MiR-125b and SCAP was assessed using a dual-luciferase reporter gene assay. * p < 0.05; ** p < 0.01. N.S., not significant.
Figure 7
Figure 7
SCAP promotes GCs steroidogenesis and proliferation. (A,B) CCK-8 assay was performed to assess the effect of SCAP overexpression and knockdown on GCs proliferation. (C) BrdU analysis was performed to assess the effect of SCAP overexpression and knockdown on GCs proliferation; scale bars are 100 µm. (D,E) Detection of E2 concentrations in GCs transfected with pcDNA3.1-SCAP and pcDNA3.1 empty plasmids, i.e., si-SCAP and si-NC. (F,G) Detection of P4 concentrations in GCs transfected with pcDNA3.1-SCAP and pcDNA3.1 empty plasmids, i.e., si-SCAP and si-NC. (H,I) RT-qPCR was used to examine the effect of overexpression and knockdown of SCAP on the expression levels of steroidogenesis-related (CYP11A1, CYP19A1, and 3β-HSD) and sterol regulation-related (SCAP and SREBP) mRNAs in GCs. (J) Overexpression and knockdown of SCAP affected the expression of steroidogenesis-related proteins and sterol regulatory element proteins. Values represent means ± SEM for three individuals. * p < 0.05; ** p < 0.01; *** p < 0.001. N.S., not significant.
Figure 8
Figure 8
LncGSAR functions as a ceRNA to regulate SCAP-SREBP pathway by sponging MiR-125b, thus promoting GCs proliferation and steroidogenesis. (A) Western blot detection of steroidogenesis-related and sterol regulatory element proteins. (B) Dual-luciferase reporter demonstrated the binding relationship among lncGSAR, MiR-125b and SCAP. (C) The interactions of lncGSAR with MiR-125b and MiR-125b with SCAP were determined by RNA-RNA interaction pull-down assay. Values represent means ± SEM for three individuals. ** p < 0.01. N.S., not significant.

Similar articles

Cited by

References

    1. Jahromi B.N., Mosallanezhad Z., Matloob N., Davari M., Ghobadifar M.A. The potential role of granulosa cells in the maturation rate of immature human oocytes and embryo development: A co-culture study. Clin. Exp. Reprod. Med. 2015;42:111–117. doi: 10.5653/cerm.2015.42.3.111. - DOI - PMC - PubMed
    1. McGee E.A., Hsueh A.J. Initial and cyclic recruitment of ovarian follicles. Endocr. Rev. 2000;21:200–214. doi: 10.1210/edrv.21.2.0394. - DOI - PubMed
    1. Dumesic D.A., Meldrum D.R., Katz-Jaffe M.G., Krisher R.L., Schoolcraft W.B. Oocyte environment: Follicular fluid and cumulus cells are critical for oocyte health. Fertil. Steril. 2015;103:303–316. doi: 10.1016/j.fertnstert.2014.11.015. - DOI - PubMed
    1. Charlier C., Montfort J., Chabrol O., Brisard D., Nguyen T., Aurélie L.C., Laurent R.P., François M., Pierre P., Svetlana U., et al. Oocyte-somatic cells interactions, lessons from evolution. BMC Genom. 2012;13:560. doi: 10.1186/1471-2164-13-560. - DOI - PMC - PubMed
    1. Fraunhoffer N.A., Abuelafia M.A., Barrientos M.A., Cimerman K.V., Olmos M.F., Chuluyan E., Barrios M. Long-term apoptosis-related protein expression in the diabetic mouse ovary. PLoS ONE. 2018;13:e0203268. doi: 10.1371/journal.pone.0203268. - DOI - PMC - PubMed

LinkOut - more resources