. 2022 Oct 13;23(20):12209.
doi: 10.3390/ijms232012209.

Altered Circulating Follicular T Helper Cell Subsets and Follicular T Regulatory Cells Are Indicators of a Derailed B Cell Response in Lupus, Which Could Be Modified by Targeting IL-21R

Affiliations

Altered Circulating Follicular T Helper Cell Subsets and Follicular T Regulatory Cells Are Indicators of a Derailed B Cell Response in Lupus, Which Could Be Modified by Targeting IL-21R

Krisztina Szabó et al. Int J Mol Sci. .

Abstract

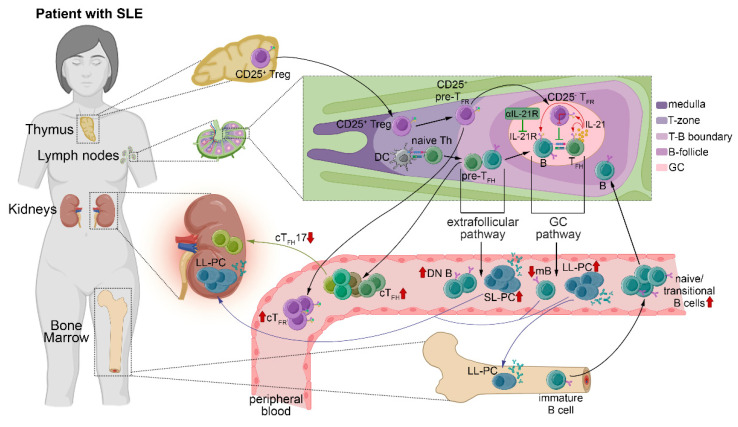
Systemic lupus erythematosus (SLE) is characterized by the breakdown of self-tolerance, the production of high-affinity pathogenic autoantibodies and derailed B cell responses, which indicates the importance of central players, such as follicular T helper (TFH) subsets and follicular T regulatory (TFR) cells, in the pathomechanism of the disease. In this study, we aimed to analyze the distribution of the circulating counterparts of these cells and their association with disease characteristics and B cell disproportions in SLE. We found that the increased percentage of activated circulating TFH (cTFH) and cTFR cells was more pronounced in cutaneous lupus; however, among cTFH subsets, the frequency of cTFH17 cells was decreased in patients with lupus nephritis. Furthermore, the decreased proportion of cTFH17 cells was associated with low complement C4 levels and high disease activity scores. We also investigated whether the blocking of the IL-21 receptor (IL-21R) with an anti-IL-21R monoclonal antibody inhibits the B cell response, since IL-21 primarily produced by TFH cells potentially promotes humoral immunity. We observed that anti-IL-21R inhibited plasmablast generation and immunoglobulin production. Our study demonstrated that, besides cTFR/cTFH imbalance, cTFH17 cells play a crucial role in SLE pathogenesis, and modulating cTFH-B cell interaction through the IL-21/IL-21R pathway may be a promising therapeutic strategy to suppress the pathological B cell response.

Keywords: B cell; chemokine receptors; follicular T helper cell; follicular T regulatory cell; interleukin-21 receptor; systemic lupus erythematosus.


Conflict of interest statement

The authors declare no conflict of interest.

Figures

Figure 1
Figure 1
The distribution of activated cTFH and TFR cells in lupus patients and healthy individuals. Peripheral blood mononuclear cells (PBMCs) were isolated from 48 SLE patients and 36 healthy controls (HC) were then stained with fluorochrome-conjugated monoclonal antibodies, as described in Materials and Methods. The proportions of peripheral activated (act.) cTFH cells and cTFR cells were quantified as their percentage within CD4+ lymphocytes. (A) Representative dot plots from an active lupus patient and HC show the identification of activated cTFH cells using ICOS and PD-1. Merged tSNE plots incorporating 30,000 CD4+ T cells from the corresponding lupus patient and healthy control show the act.cTFH cluster identified by tSNE clustering analysis (red color represents act.cTFH). Histograms show the expression of markers used to identify act.cTFH cells. (B) Percentages of act.cTFH cells. (C) Representative dot plots from an active SLE patient and HC show the identification of cTFR cells by CD127 and CD25. Merged tSNE plots incorporating 30,000 CD4+ T cells from the corresponding lupus patient and healthy control show the cTFR cluster identified by t-SNE clustering analysis (magenta color represents cTFR). Histograms show the expression of markers used to identify cTFR cells. (D) Percentages of cTFR cells. (E) The proportions of act.cTFH and cTFR clusters among CD4+ T cells were indicated by the horizontal bars. Mann–Whitney nonparametric test was used (C,E). Box plots represent the interquartile range (IQR) with a line in the middle as the median. Statistically significant differences are indicated by *** p < 0.001; **** p < 0.0001.
Figure 2
Figure 2
The imbalance of cTFH subsets in SLE patients and their association with disease characteristics. PBMCs were isolated from 48 SLE patients and 36 healthy controls (HC) were then stained with fluorochrome-conjugated monoclonal antibodies, as described in Materials and Methods. The percentages of blood cTFH cell subsets were quantified as their percentage within CD4+ lymphocytes. (A) Representative dot plots from an active SLE patient and HC show the identification of cTFH subsets: cTFH1 (CXCR3+CCR6), cTFH1/17 (CXCR3+CCR6+), cTFH2 (CXCR3CCR6) and cTFH17 (CXCR3CCR6+) cells. Merged t-SNE plots incorporating 30,000 CD4+ T cells from the corresponding lupus patient and healthy control show cTFH clusters identified by t-SNE clustering analysis (each color represents a different cluster: cTFH1, purple; cTFH1/17, blue; cTFH2, orange; cTFH17, green). Histograms show the expression of markers used to identify each cTFH subset. (B) The proportions of cTFH clusters among CD4+ T cells were indicated by the horizontal bars. (C) Percentages of cTFH subsets. (D) The receiver operating characteristic (ROC) curves were performed to evaluate the efficiency of cTFH cell subsets to predict lupus when compared to controls. Colored lines indicate areas under the ROC curves (AUC) which are considered acceptable. (E) Percentages of different cTFH subsets in patients with lupus nephritis (LN, n = 15), cutaneous lupus (CL, n = 13) and HC. (F) Correlation matrix represents the association between the percentages of cTFH cell subsets, cTFR cells and different serological parameters (anti [α]-dsDNA, immune complex [IC], complement [C] 3, 4 and SLEDAI) in patients with SLE. Positive correlations are displayed in red and negative correlations in blue. Color intensity and the size of the circle are proportional to the Spearman’s correlation coefficient. Two-way analysis of variance (ANOVA) with a Sidak post hoc test was used. Box plots represent the interquartile range (IQR) with a line in the middle as the median. Statistically significant differences are indicated by * p < 0.05; ** p < 0.01; *** p < 0.001; **** p < 0.0001.
Figure 3
Figure 3
Abnormal B cell distribution and their association with SLE laboratory and clinical features. PBMCs were isolated from 48 SLE patients and 36 healthy controls (HC), and were then stained with fluorochrome-conjugated monoclonal antibodies, as described in Materials and Methods. The percentages of B cell subsets were quantified as their percentages within CD19+ lymphocytes. (A) Representative dot plots show the determination of IgD+CD27 naive B (nB) cells, IgD+CD27+ un-switched memory B (US.mB) cells, IgDCD27+ switched memory B (S.mB) cells and IgDCD27 double negative (DN) B cells. (B) The proportions of naive and memory B cell subsets. (C) Representative dot plots show the identification of CD38hiCD24hiCD27 transitional B (trans.B) cells, CD38intCD24int mature-naive B (mn.B) cells and CD38CD24hiCD27+ primarily memory B (pm.B) cells. (D) The proportions of trans.B, mn.B and pm.B cell subpopulations. (E) The percentages of CD38+CD27hi plasmablasts. (F) Correlation matrix represents the association between the percentages of B cell subsets and cTFR cells, cTFH subpopulations, as well as routine laboratory parameters (anti [α]-dsDNA, immune complex [IC], complement [C] 3, 4 and SLEDAI) in patients with SLE. Positive correlations are displayed in red and negative correlations in blue. Color intensity and the size of the circle are proportional to the Spearman’s correlation coefficient. (G) Percentages of different B cell subsets in patients with lupus nephritis (LN, n = 15), cutaneous lupus (CL, n = 13) and HC. Two-way analysis of variance (ANOVA) with a Sidak post hoc test was used. Box plots represent the interquartile range (IQR) with a line in the middle as the median. Statistically significant differences are indicated by * p < 0.05; ** p < 0.01; *** p < 0.001; **** p < 0.0001.
Figure 4
Figure 4
Anti (α)-IL-21R inhibits TFH cell-dependent B cell differentiation in SLE patients and healthy individuals. (A) Representative contour plots show the gating strategy and the blocking of plasmablast differentiation by αIL-21R in SLE. As an isotype control, the IgG1 protein was used. (B) Percentages of 7-AADCD4CD27+CD38hi viable plasmablasts were measured by flow cytometry in healthy controls (HC; n = 3) and in SLE patients (n = 3). Fold change of IgM (C) and IgG (D) was measured by ELISA in patients with lupus and HC. Bar charts represent mean ± SD. Data analysis was performed with two-way ANOVA followed by Tukey’s multiple comparison tests. Statistically significant differences are defined as * p < 0.05; ** p < 0.01; *** p < 0.001; **** p < 0.0001.
Figure 5
Figure 5
Summarizing the outcome of TFR/TFH cell imbalance and altered B cell differentiation in SLE. Incomplete induction of self-tolerance and B cell hyperactivity induced by disturbed immune regulation are the hallmark of lupus pathogenesis. The breakdown of early B cell tolerance leads to consequential enrichment of the ratio of transitional B cells and naive/mature–naive B cells in the circulation. The microenvironment of GCs gives place to peripheral tolerance, where TFR cells and TFH cells collaborate to regulate the multistage differentiation of B cells. TFH cells produce IL-21, which facilitates the GC reaction by promoting TFH and B cell differentiation, while inhibiting TFR function. The imbalance of TFR cell and TFH cell homeostasis in lymph nodes culminates in an increased number of activated cTFH and cTFR cells at the periphery, along with characteristic changes in the distribution of B cell subpopulations. We hypothesize that cTFH17 cells may traffic to the site of inflammation, where they collaborate with the accumulated antibody-secreting cells and memory B cells within kidney tissues, which contributes to the progression of the disease. DC, dendritic cell; DN B, double negative B cell; GC, germinal center; IL-21, interleukin-21; IL-21R, interleukin-21 receptor; LL-PC, long-lived plasma cell; mB, memory B cell; SL-PC, short-lived plasma cell; SLE, systemic lupus erythematosus; Treg, regulatory T cell; TFR, follicular T regulatory cell; TFH, follicular T helper cells. [Some icons were inspired by Biorender.com accessed on 16 August 2022.].

References

    1. Thanou A., Jupe E., Purushothaman M., Niewold T.B., Munroe M.E. Clinical disease activity and flare in SLE: Current concepts and novel biomarkers. J. Autoimmun. 2021;119:102615. doi: 10.1016/j.jaut.2021.102615. - DOI - PMC - PubMed
    1. Tarr T., Papp G., Nagy N., Cserep E., Zeher M. Chronic high-dose glucocorticoid therapy triggers the development of chronic organ damage and worsens disease outcome in systemic lupus erythematosus. Clin. Rheumatol. 2017;36:327–333. doi: 10.1007/s10067-016-3492-6. - DOI - PubMed
    1. Kaul A., Gordon C., Crow M.K., Touma Z., Urowitz M.B., van Vollenhoven R., Ruiz-Irastorza G., Hughes G. Systemic lupus erythematosus. Nat. Rev. Dis. Primers. 2016;2:16039. doi: 10.1038/nrdp.2016.39. - DOI - PubMed
    1. Li Q., Wu H., Liao W., Zhao M., Chan V., Li L., Zheng M., Chen G., Zhang J., Lau C.S., et al. A comprehensive review of immune-mediated dermatopathology in systemic lupus erythematosus. J. Autoimmun. 2018;93:1–15. doi: 10.1016/j.jaut.2018.07.007. - DOI - PubMed
    1. Anders H.J., Saxena R., Zhao M.H., Parodis I., Salmon J.E., Mohan C. Lupus nephritis. Nat. Rev. Dis. Primers. 2020;6:7. doi: 10.1038/s41572-019-0141-9. - DOI - PubMed

MeSH terms