. 2022 Oct 14;23(20):12258.
doi: 10.3390/ijms232012258.

NAC1 Maintains Root Meristem Activity by Repressing the Transcription of E2Fa in Arabidopsis

Affiliations

NAC1 Maintains Root Meristem Activity by Repressing the Transcription of E2Fa in Arabidopsis

Chuantian Xie et al. Int J Mol Sci. .

Abstract

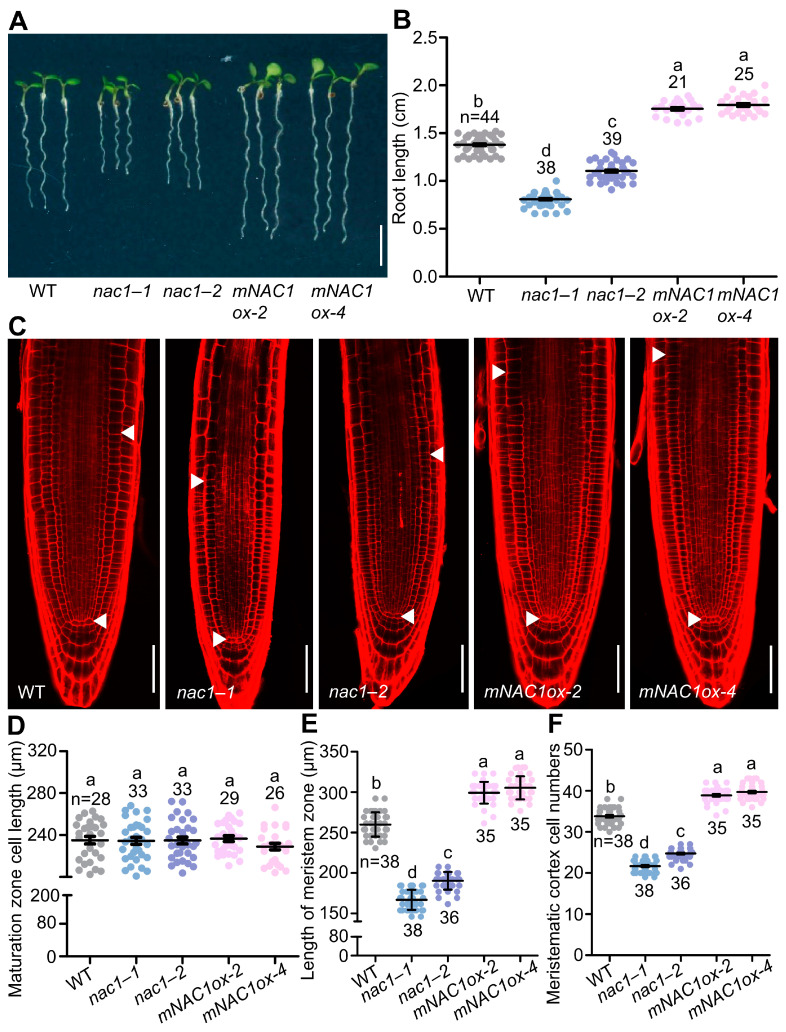
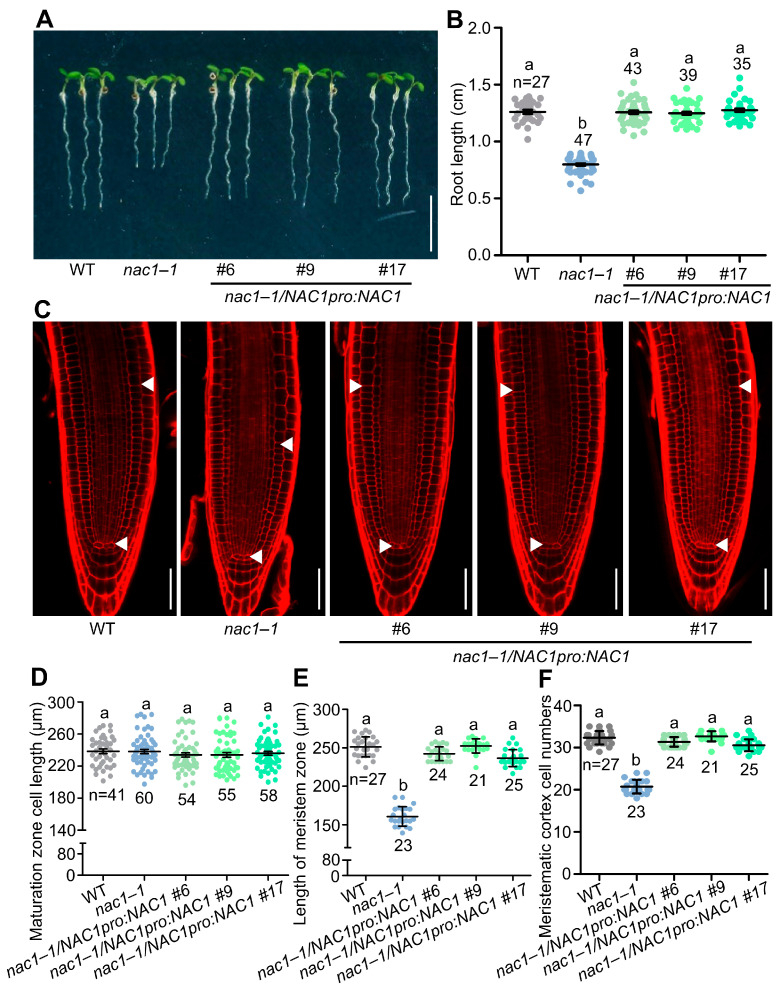
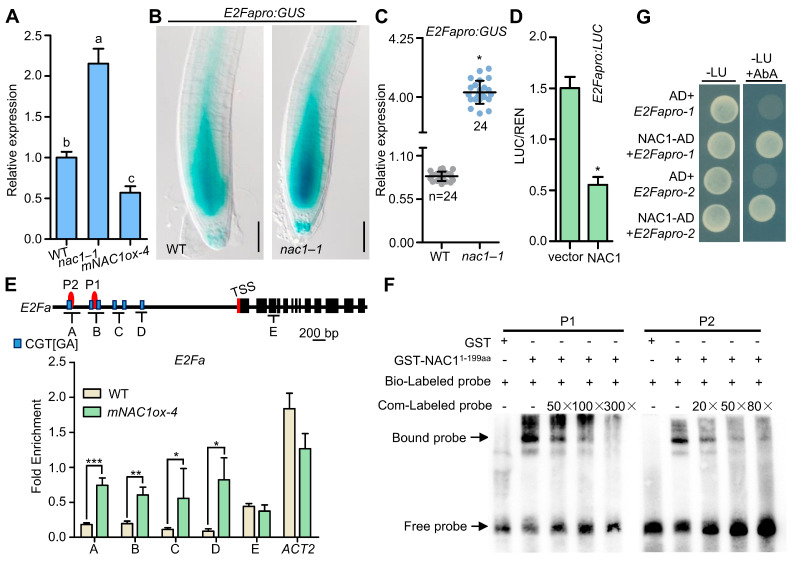
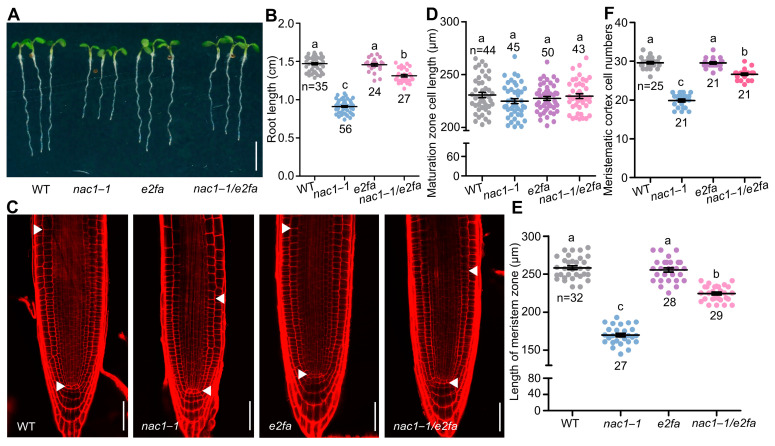
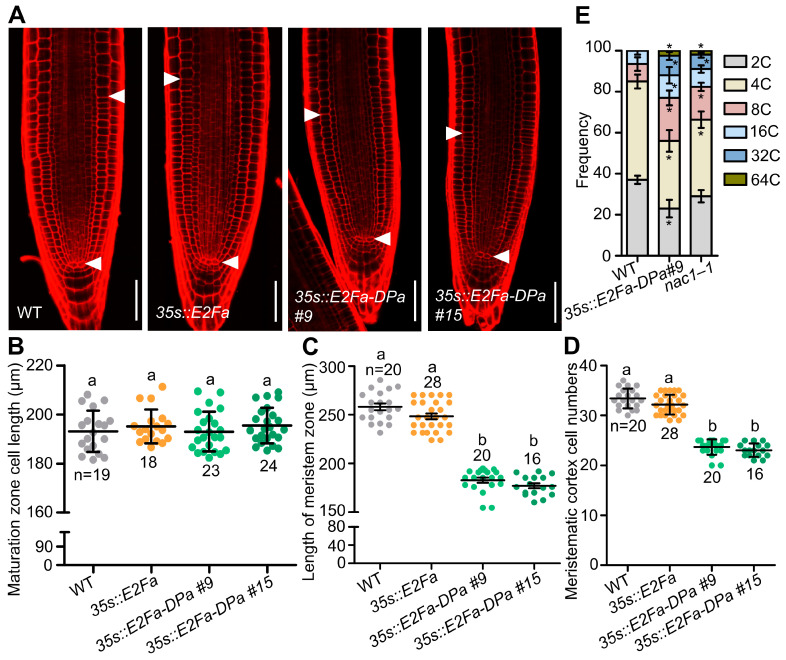
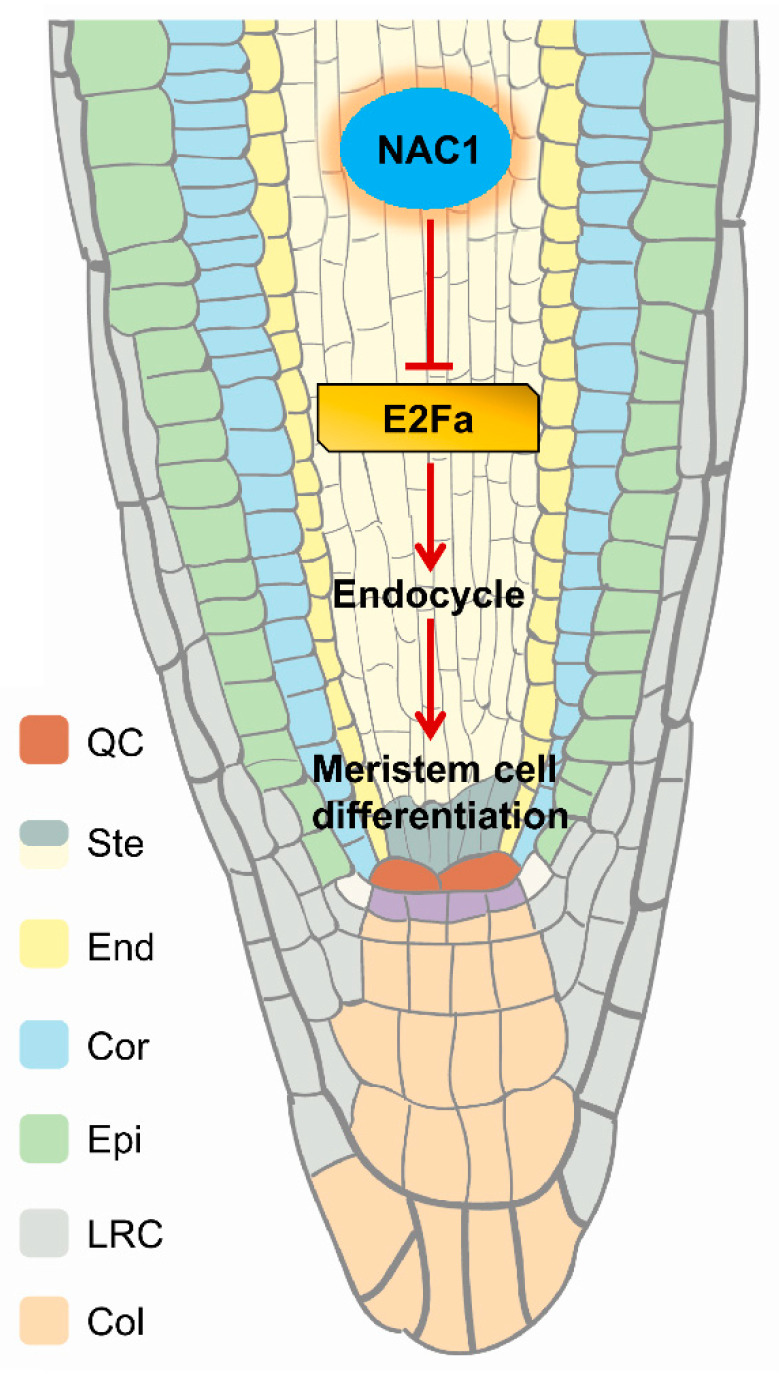
Root meristem is a reserve of undifferentiated cells which guide root development. To maintain root meristem identity and therefore continuous root growth, the rate of cell differentiation must coordinate with the rate of generation of new cells. The E2 promoter-binding factor a (E2Fa) has been shown to regulate root growth through controlling G1/S cell cycle transitions in Arabidopsis thaliana. Here, we found that NAC1, a member of the NAM/ATAF/CUC family of transcription factors, regulated root growth by directly repressing the transcription of E2Fa. Loss of NAC1 triggers an up-regulation of the E2Fa expression and causes a reduced meristem size and short-root phenotype, which are largely rescued by mutation of E2Fa. Further analysis showed that NAC1 was shown to regulate root meristem by controlling endopolyploidy levels in an E2Fa-dependent manner. This study provides evidence to show that NAC1 maintains root meristem size and root growth by directly repressing the transcription of E2Fa in Arabidopsis.

Keywords: E2Fa; NAC1; endoreduplication; meristem; root.


Conflict of interest statement

The authors declare no conflict of interests.

Figures

Figure 1
Figure 1
NAC1 is required for primary root growth. (A) The root growth phenotypes of WT, nac11, nac12, and two independent overexpression transgenic lines of mNAC1ox-2 or mNAC1ox-4 grown on 1/2 MS medium. The seedlings were photographed at 5 days post-germination (dpg). Scale bar represents 0.5 cm. (B) Measurements of primary root length of WT, nac1–1, nac1–2, and two independent overexpression transgenic lines as shown in (A). (C) Confocal images of root tips of WT, nac1–1, nac1–2, and two independent overexpression transgenic lines as shown in (A). The seedlings were used at 5 dpg for imaging. White arrows indicate the boundary between root meristem and transition zones. White arrows below indicate the quiescent center (QC). Scale bars represent 50 μm. (D) Root cortical cell length in the maturation zone of 5 dpg seedlings as shown in (C). (E) Length of meristem zone of 5 dpg seedlings as shown in (C). (F) Cell numbers in the proliferation domain of 5 dpg seedlings as shown in (C). Data information: in (B,DF), data represent mean ± SD, n denotes the total number of scored samples. Individual values (black dots) are shown. Different lowercase letters indicate significant differences by one-way ANOVA followed by Tukey’s multiple comparison test (p < 0.05).
Figure 2
Figure 2
NAC1pro:NAC1 rescues the short-root-length phenotype in nac11. (A) The root growth phenotypes of WT, nac11, and three biological translational transgenic lines of NAC1pro:NAC1 in nac11 mutant background grown on 1/2 MS medium. The seedlings were photographed at 5 dpg. Scale bar represents 0.5 cm. (B) Measurements of primary root length of WT, nac11, and three biological translational transgenic lines of NAC1pro:NAC1 in nac11 mutant background as shown in (A). (C) Confocal images of root tips of WT, nac11, and three biological translational transgenic lines of NAC1pro:NAC1 in nac11 mutant background as shown in (A). The seedlings were used at 5 dpg for imaging. White arrows indicate the boundary between root meristem and transition zones. White arrows below indicate the QC. Scale bars represent 50 μm. (D) Root cortical cell length in the maturation zone of 5 dpg seedlings as shown in (C). (E) Length of meristem zone of 5 dpg seedlings as shown in (C). (F) Cell numbers in the proliferation domain of 5 dpg seedlings as shown in (C). Data information: in (B,DF) data represent mean ± SD, n denotes the total number of scored samples. Individual values (black dots) are shown. Different lowercase letters indicate significant differences by one-way ANOVA followed by Tukey’s multiple comparison test (p < 0.05).
Figure 3
Figure 3
NAC1 directly binds to E2Fa promoter and represses its expression. (A) RT-qPCR analysis of E2Fa expression in WT, nac11, and mNAC1ox-4. Total RNA was extracted from primary root of 5 dpg seedlings. The expression level in seedlings was defined as “1”. Three biological replicates with three technical replicates for each biological replicate were performed with similar results. Data represent mean ± SE of three biological replicates. Different letters above bars indicate a significant difference (one-way ANOVA, Tukey’ multiple comparisons test, p < 0.05). (B) Expression of the E2Fapro:GUS in WT, nac11 roots. E2Fapro:GUS crossed with nac11 seedling. The seedlings were photographed at 5 dpg. Scale bar represents 50 μm. (C) Statistical analysis of E2Fapro:GUS expression in (B). Data represent mean ± SD, n denotes the total number of scored samples. Individual values (black dots) are shown (Student’s t test, * p < 0.05). (D) NAC1 transrepresses the E2Fa promoter in Arabidopsis leaf protoplasts. The effector (35s::NAC1) and reporter (E2Fapro:LUC) constructs. The empty vector pBI221 was used as a negative control. Three biological replicates with three technical replicates for each biological replicate were performed with similar results. Data represent mean ± SE of three biological replicates. * means differ significantly (p < 0.05) from the negative control. (E) Schematic diagram of the E2Fa and PCR amplicons (indicated as letters A–E) used for ChIP-qPCR. TSS, transcription start site. ChIP-qPCR results show the enrichment of NAC1 on the chromatin of E2Fa. Sonicated chromatins from 5 dpg seedlings (35s::MYC-mNAC1) were precipitated with anti-Myc antibodies. The precipitated DNA was used as a template for qPCR analysis, with primers targeting different regions of the E2Fa as shown in (E). Three biological replicates with three technical replicates for each biological replicate were performed with similar results. Data represent mean ± SE of three biological replicates (*** p < 0.001, ** p < 0.01, * p < 0.05, Student’s t test). (F) Electrophoretic mobility shift assay (EMSA) shows that NAC1 (1–199aa) binds the putative motif in the E2Fa promoter. The biotin-labeled probes (P1 and P2) are indicated in (E). Unlabeled probes were used in the competition assay. (G) Yeast one-hybrid binding assay involving NAC1 and E2Fa promoters. The yeast transformants were dropped onto SD-L-U (-Leu, -Ura) media. Aureobasidin A (AbA) concentration with 290 ng/mL. E2Fapro-1 spans from −1211 to −647 bp; E2Fapro-2 spans from −646 to −1 bp.
Figure 4
Figure 4
E2Fa acts downstream of NAC1 to control root growth. (A) The root growth phenotypes of WT, nac1–1, e2fa, and nac1–1/e2fa grown on 1/2 MS medium. The seedlings were photographed at 5 dpg. Scale bar represents 0.5 cm. (B) Measurements of primary root length of WT, nac1–1, e2fa, and nac1–1/e2fa as shown in (A). (C) Confocal images of root tips of WT, nac1–1, e2fa, and nac1–1/e2fa as shown in (A). The seedlings were used at 5 dpg for imaging. White arrows indicate the boundary between root meristem and transition zones. White arrows below indicate the QC. Scale bars represent 50 μm. (D) Root cortical cell length in the maturation zone of 5 dpg seedlings as shown in (C). (E) Length of meristem zone of 5 dpg seedlings as shown in (C). (F) Cell numbers in the proliferation domain of 5 dpg seedlings as shown in (C). Data information: in (B,DF), data represent mean ± SD, n denotes the total number of scored samples. Individual values (black dots) are shown. Different lowercase letters indicate significant differences by one-way ANOVA followed by Tukey’s multiple comparison test (p < 0.05).
Figure 5
Figure 5
Overexpression E2Fa-Dpa complex affects root length by promoting endoreduplication. (A) Confocal images of root tips of WT, 35s::E2Fa, and two independent overexpression transgenic lines of E2Fa-DPa. The seedlings were used at 5 dpg for imaging. White arrows indicate the boundary between root meristem and transition zones. Scale bars represent 50 μm. (B) Root cortical cell length in the maturation zone of 5 dpg seedlings as shown in (A). (C) Length of meristem zone of 5 dpg seedlings as shown in (A). (D) Cell numbers in the proliferation domain of 5 dpg seedlings as shown in (A). (E) Distribution of nuclear ploidy in the root meristem cells of WT, 35s::E2Fa-DPa #9, and nac1–1, using flow cytometry at 4 dpg. Two independent experiments were performed, and representative results are presented (Student’s t test, * p < 0.05). Data information: in (BD), data represent mean ± SD, n denotes the total number of scored samples. Individual values (black dots) are shown. Different lowercase letters indicate significant differences by one-way ANOVA followed by Tukey’s multiple comparison test (p < 0.05).
Figure 6
Figure 6
Hypothetical model for the regulation of primary root development by NAC1. NAC1 plays a critical role in primary root growth by directly binding to the promoter and thus repressing the transcription of E2Fa. Loss of NAC1 triggers the up-regulation of E2Fa expression, which affects root meristem cell differentiation through the regulation of endocycle.

Similar articles

Cited by

References

    1. Petricka J.J., Winter C.M., Benfey P.N. Control of Arabidopsis root development. Annu. Rev. Plant Biol. 2012;63:563–590. doi: 10.1146/annurev-arplant-042811-105501. - DOI - PMC - PubMed
    1. Sharma V.K., Carles C., Fletcher J.C. Maintenance of stem cell populations in plants. Proc. Natl. Acad. Sci. USA. 2003;100((Suppl. S1)):11823–11829. doi: 10.1073/pnas.1834206100. - DOI - PMC - PubMed
    1. Leyser O. Auxin distribution and plant pattern formation: How many angels can dance on the point of PIN? Cell. 2005;121:819–822. doi: 10.1016/j.cell.2005.06.005. - DOI - PubMed
    1. Sabatini S., Beis D., Wolkenfelt H., Murfett J., Guilfoyle T., Malamy J., Benfey P., Leyser O., Bechtold N., Weisbeek P., et al. An auxin-dependent distal organizer of pattern and polarity in the Arabidopsis root. Cell. 1999;99:463–472. doi: 10.1016/S0092-8674(00)81535-4. - DOI - PubMed
    1. Aichinger E., Kornet N., Friedrich T., Laux T. Plant stem cell niches. Annu. Rev. Plant Biol. 2012;63:615–636. doi: 10.1146/annurev-arplant-042811-105555. - DOI - PubMed

MeSH terms

LinkOut - more resources