. 2022 Oct 21;23(20):12657.
doi: 10.3390/ijms232012657.

Drug Repurposing for Cystic Fibrosis: Identification of Drugs That Induce CFTR-Independent Fluid Secretion in Nasal Organoids

Affiliations

Drug Repurposing for Cystic Fibrosis: Identification of Drugs That Induce CFTR-Independent Fluid Secretion in Nasal Organoids

Lisa W Rodenburg et al. Int J Mol Sci. .

Abstract

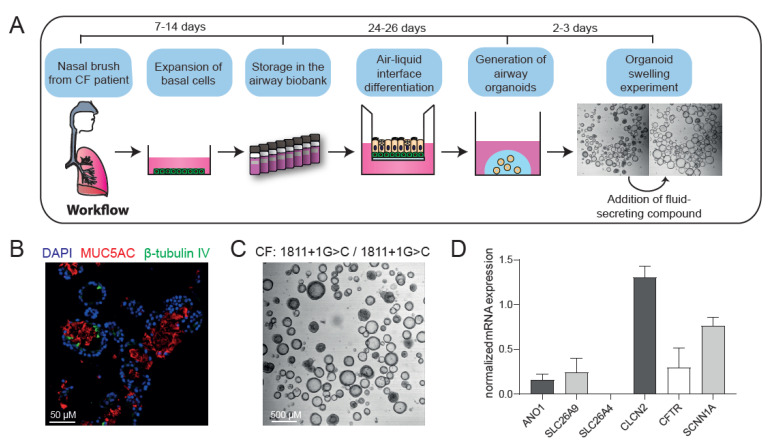
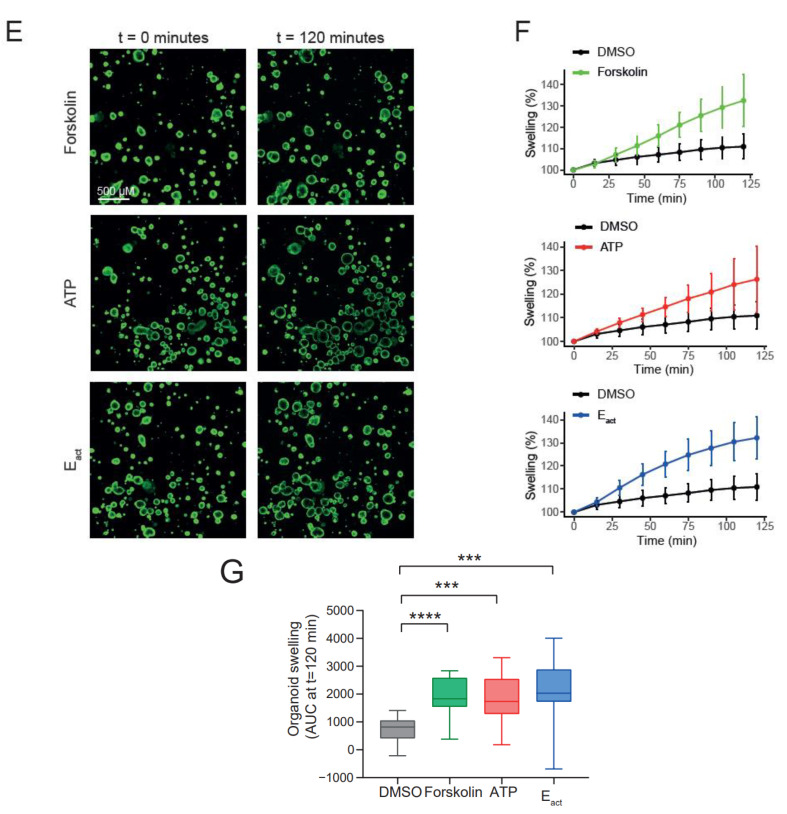
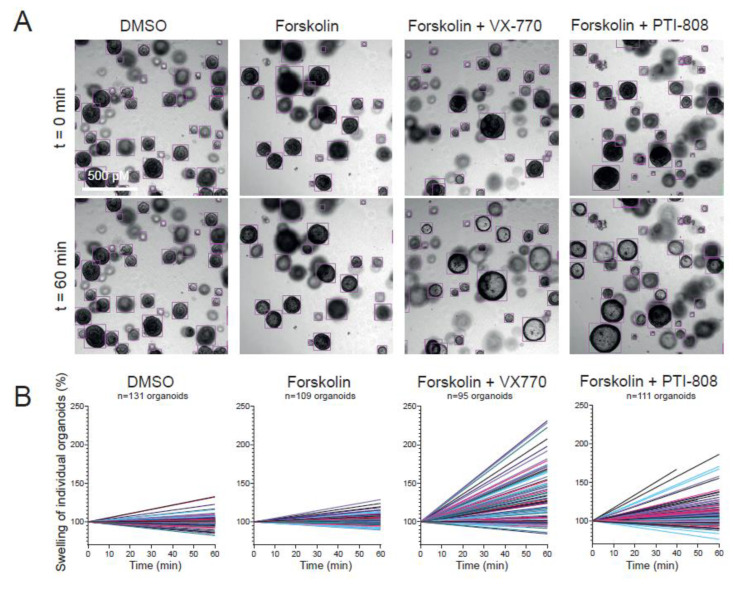
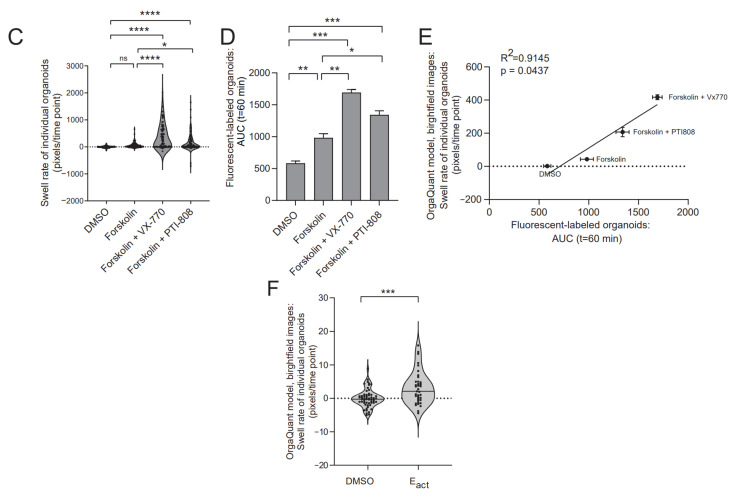
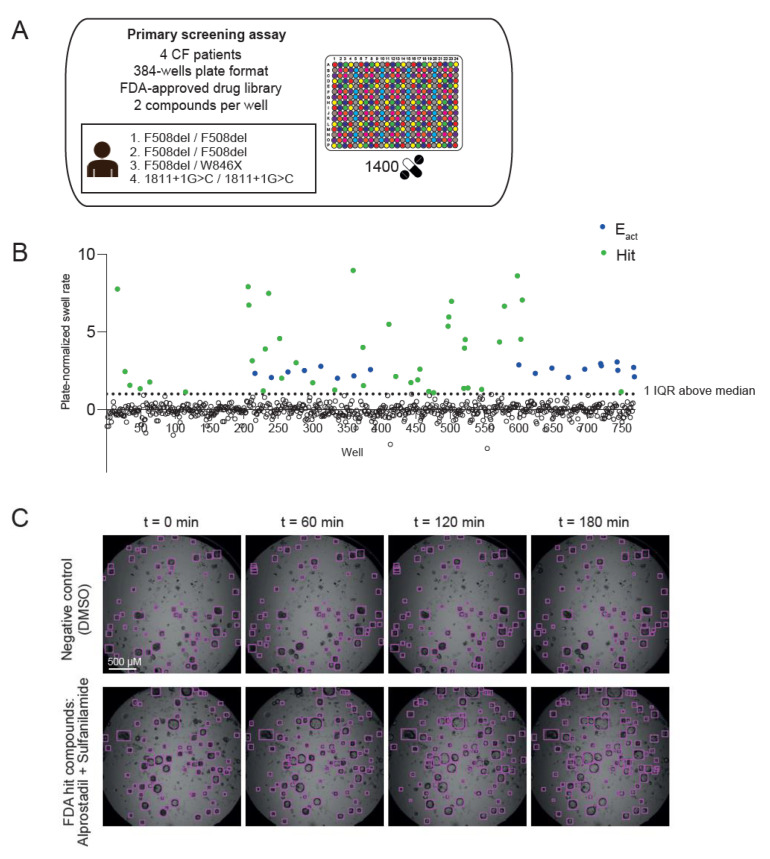
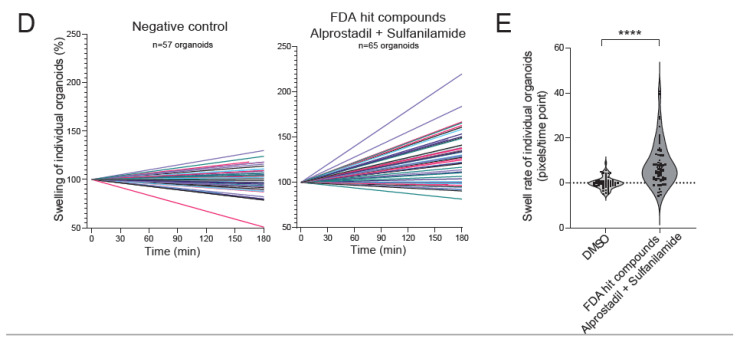
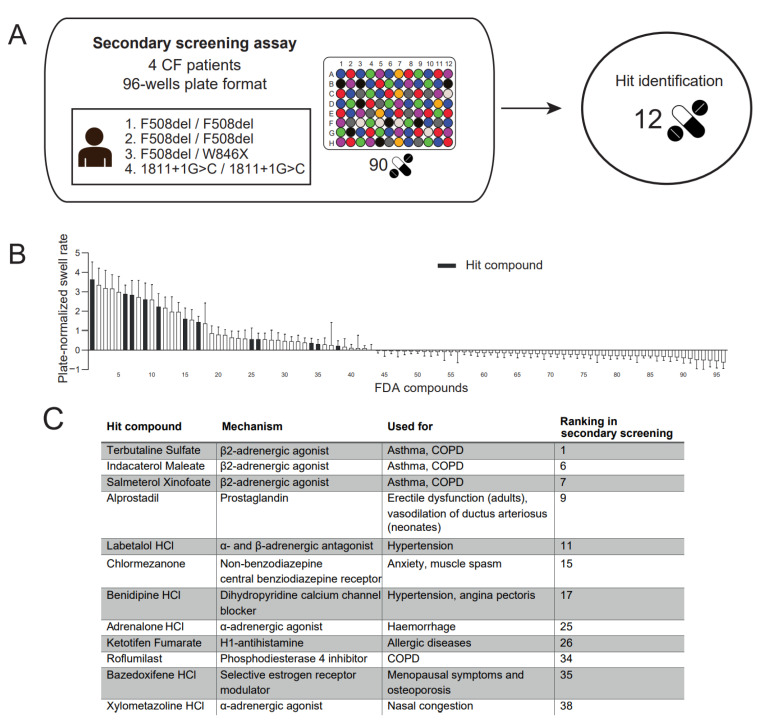
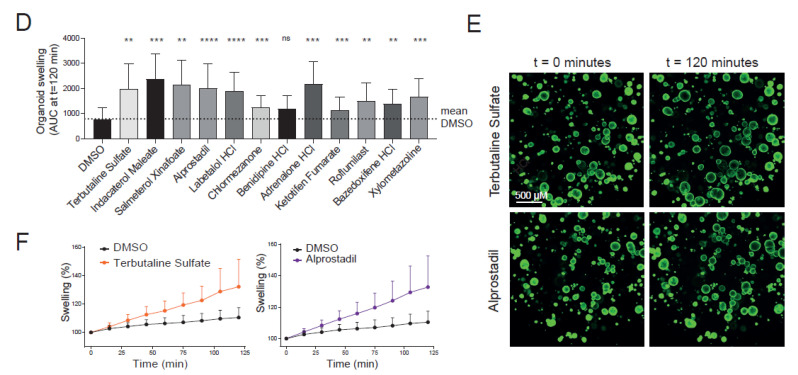
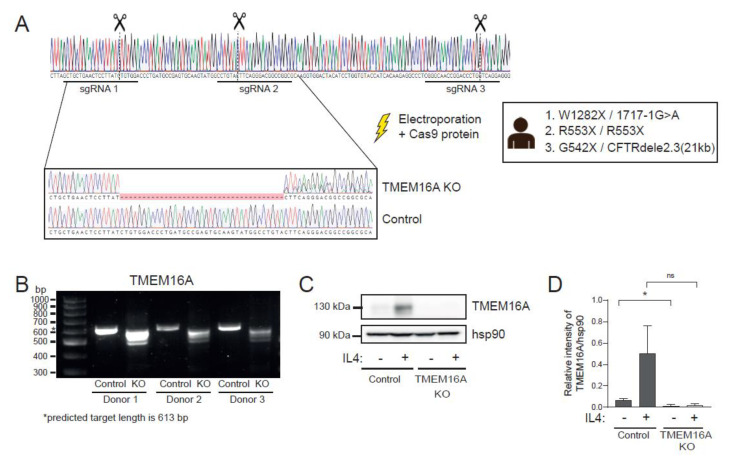
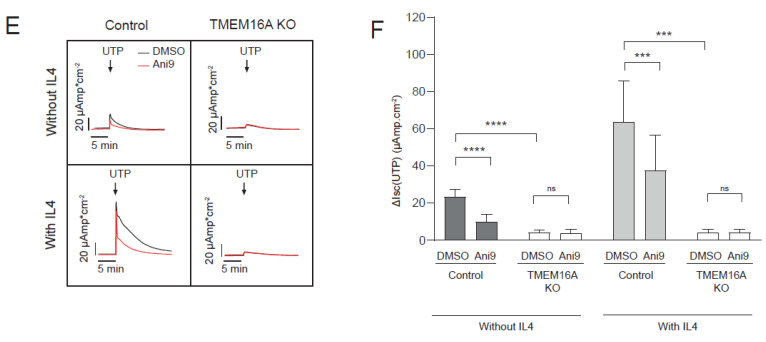
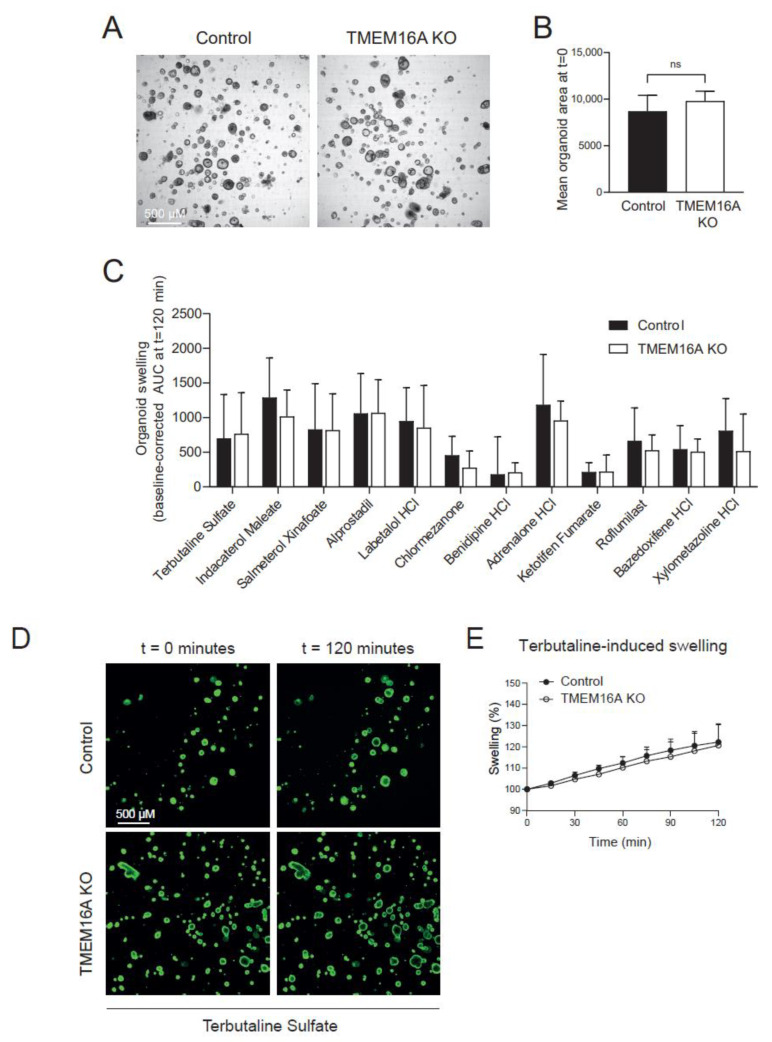
Individuals with cystic fibrosis (CF) suffer from severe respiratory disease due to a genetic defect in the cystic fibrosis transmembrane conductance regulator (CFTR) gene, which impairs airway epithelial ion and fluid secretion. New CFTR modulators that restore mutant CFTR function have been recently approved for a large group of people with CF (pwCF), but ~19% of pwCF cannot benefit from CFTR modulators Restoration of epithelial fluid secretion through non-CFTR pathways might be an effective treatment for all pwCF. Here, we developed a medium-throughput 384-well screening assay using nasal CF airway epithelial organoids, with the aim to repurpose FDA-approved drugs as modulators of non-CFTR-dependent epithelial fluid secretion. From a ~1400 FDA-approved drug library, we identified and validated 12 FDA-approved drugs that induced CFTR-independent fluid secretion. Among the hits were several cAMP-mediating drugs, including β2-adrenergic agonists. The hits displayed no effects on chloride conductance measured in the Ussing chamber, and fluid secretion was not affected by TMEM16A, as demonstrated by knockout (KO) experiments in primary nasal epithelial cells. Altogether, our results demonstrate the use of primary nasal airway cells for medium-scale drug screening, target validation with a highly efficient protocol for generating CRISPR-Cas9 KO cells and identification of compounds which induce fluid secretion in a CFTR- and TMEM16A-indepent manner.

Keywords: TMEM16A; cystic fibrosis; drug repurposing; nasal organoids; screening assay.


Conflict of interest statement

J.M.B. has a patent granted (10006904) related to CFTR function measurements in organoids and received personal fees from HUB/Royal Dutch academy of sciences, during the conduct of the study; nonfinancial support from Vertex Pharmaceuticals and personal fees and nonfinancial support from Proteostasis Therapeutics, outside the submitted work. C.K.v.d.E. reports grants from GSK, Nutricia, TEVA, Gilead, Vertex, ProQR, Proteostasis, Galapagos NV, Eloxx pharmaceuticals, outside the submitted work; In addition, C.K.v.d.E. has a patent related to CFTR function measurements in organoids (10006904) with royalties paid.

Figures

Figure 1
Figure 1
Characterization of CF nasal organoids and CFTR-independent organoid swelling. (A) Schematic representation of the project workflow from nasal brush towards organoid swelling experiments; (B) immunofluorescence staining of nasal organoids with the secretory cell marker MUC5AC (red), ciliated cell marker β-tubulin IV (green) and DAPI (blue) from a CF donor (F508del/S1251N); (C) brightfield image showing intrinsic lumen formation of unstimulated nasal organoids from a CFTR-null donor (1811+1G>C/1811+1G>C); (D) mRNA expression in CFTR-null nasal organoids of the following ion channels/transporters: ANO1 (TMEM16A), SLC26A9, SLC26A4, CLCN2, SCNN1A and CFTR (n = 3 independent donors; W1282X/1717-1G>A, R553X/R553X, G542X/CFTRdele2.3 (21 kb)); (E) confocal images of CFTR-null (G542X/CFTRdele2.3(21 kb)) nasal organoids, stimulated with forskolin (5 µM), ATP (100 µM) or Eact (10 µM) at 0 and 120 min; (F) quantification of CFTR-null (G542X/CFTRdele2.3(21 kb), n = 5 replicates) nasal organoid swelling after stimulation with forskolin, ATP or Eact; (G) area under the curve (AUC) plots of nasal organoid swelling in three CFTR-null donors (n = 3 independent donors; W1282X/1717-1G>A, R553X/R553X, G542X/CFTRdele2.3 (21 kb); 2–6 replicates per donor) after stimulation with forskolin, ATP or Eact. Analysis of difference with control was determined with a one-way ANOVA with Dunnett’s post hoc test (G). *** p < 0.001, **** p < 0.0001.
Figure 1
Figure 1
Characterization of CF nasal organoids and CFTR-independent organoid swelling. (A) Schematic representation of the project workflow from nasal brush towards organoid swelling experiments; (B) immunofluorescence staining of nasal organoids with the secretory cell marker MUC5AC (red), ciliated cell marker β-tubulin IV (green) and DAPI (blue) from a CF donor (F508del/S1251N); (C) brightfield image showing intrinsic lumen formation of unstimulated nasal organoids from a CFTR-null donor (1811+1G>C/1811+1G>C); (D) mRNA expression in CFTR-null nasal organoids of the following ion channels/transporters: ANO1 (TMEM16A), SLC26A9, SLC26A4, CLCN2, SCNN1A and CFTR (n = 3 independent donors; W1282X/1717-1G>A, R553X/R553X, G542X/CFTRdele2.3 (21 kb)); (E) confocal images of CFTR-null (G542X/CFTRdele2.3(21 kb)) nasal organoids, stimulated with forskolin (5 µM), ATP (100 µM) or Eact (10 µM) at 0 and 120 min; (F) quantification of CFTR-null (G542X/CFTRdele2.3(21 kb), n = 5 replicates) nasal organoid swelling after stimulation with forskolin, ATP or Eact; (G) area under the curve (AUC) plots of nasal organoid swelling in three CFTR-null donors (n = 3 independent donors; W1282X/1717-1G>A, R553X/R553X, G542X/CFTRdele2.3 (21 kb); 2–6 replicates per donor) after stimulation with forskolin, ATP or Eact. Analysis of difference with control was determined with a one-way ANOVA with Dunnett’s post hoc test (G). *** p < 0.001, **** p < 0.0001.
Figure 2
Figure 2
Quantification of nasal organoid swelling in a 384-well plate format by the OrgaQuant neural network. (A) Representative brightfield images showing automatic recognition of CF nasal organoids (F508del/S1251N) with the OrgaQuant model [18]. To examine swelling, organoids were treated with the vehicle DMSO, forskolin alone (5 µM) or a combination of forskolin (5 µM) with the CFTR potentiators VX-770 (5 µM) or PTI-808 (1 µM); (B) graphs show percentage change in surface area relative to t = 0 (100%) of individual organoids, treated with vehicle DMSO, forskolin, forskolin with VX-770 or forskolin with PTI-808, corresponding to the wells from (A). Each line represents an individual organoid; (C) swell rates (pixels/time point) of individual organoids from the wells shown in (A) are displayed (one representative well per condition is shown); (D) analysis of FIS using the conventional quantification method in fluorescent-labeled organoids, using the same donor as in (AC) (n = 1 donor, F508del/S1251N, 2 biological replicates). Organoids were treated with vehicle DMSO, forskolin (5 µM), forskolin with Vx770 (5 µM) or forskolin with PTI-808 (1 µM). AUC is used as outcome measurement for organoid swelling; (E) correlation between two analysis methods for FIS in a similar donor: in the new developed method, organoids in brightfield images are recognized using OrgaQuant and swell rate (pixels/time point) is used as outcome measurement for swelling. In the conventional method, fluorescent-labeled organoids are recognized with image software Zen Blue and AUC values are used as outcome measurement for swelling; (F) swell rates of individual organoids within a single well stimulated with DMSO or Eact (10 µM) in a CFTR-null donor (1811+1G>C/1811+1G>C). Analysis of differences was performed using unpaired t-tests (F), one-way ANOVA wit Tukey post hoc test (C,D) or Pearson correlation (E). ns = non-significant, * p < 0.05, ** p < 0.01, *** p < 0.001, **** p < 0.0001.
Figure 2
Figure 2
Quantification of nasal organoid swelling in a 384-well plate format by the OrgaQuant neural network. (A) Representative brightfield images showing automatic recognition of CF nasal organoids (F508del/S1251N) with the OrgaQuant model [18]. To examine swelling, organoids were treated with the vehicle DMSO, forskolin alone (5 µM) or a combination of forskolin (5 µM) with the CFTR potentiators VX-770 (5 µM) or PTI-808 (1 µM); (B) graphs show percentage change in surface area relative to t = 0 (100%) of individual organoids, treated with vehicle DMSO, forskolin, forskolin with VX-770 or forskolin with PTI-808, corresponding to the wells from (A). Each line represents an individual organoid; (C) swell rates (pixels/time point) of individual organoids from the wells shown in (A) are displayed (one representative well per condition is shown); (D) analysis of FIS using the conventional quantification method in fluorescent-labeled organoids, using the same donor as in (AC) (n = 1 donor, F508del/S1251N, 2 biological replicates). Organoids were treated with vehicle DMSO, forskolin (5 µM), forskolin with Vx770 (5 µM) or forskolin with PTI-808 (1 µM). AUC is used as outcome measurement for organoid swelling; (E) correlation between two analysis methods for FIS in a similar donor: in the new developed method, organoids in brightfield images are recognized using OrgaQuant and swell rate (pixels/time point) is used as outcome measurement for swelling. In the conventional method, fluorescent-labeled organoids are recognized with image software Zen Blue and AUC values are used as outcome measurement for swelling; (F) swell rates of individual organoids within a single well stimulated with DMSO or Eact (10 µM) in a CFTR-null donor (1811+1G>C/1811+1G>C). Analysis of differences was performed using unpaired t-tests (F), one-way ANOVA wit Tukey post hoc test (C,D) or Pearson correlation (E). ns = non-significant, * p < 0.05, ** p < 0.01, *** p < 0.001, **** p < 0.0001.
Figure 3
Figure 3
Primary screening assay of an FDA-approved drug library in CF nasal organoids. (A) ~1400 FDA-approved drugs (3 µM) were screened in a 384-well plate format in nasal organoids from 4 pwCF. Two compounds were combined in a single well; (B) the graph represents mean plate-normalized swell rates of four CF donors. A total of 90 compounds (shown in green), divided over 45 wells, with a plate-normalized swell rate above 1 IQR above the median were selected from the primary screening assay for the secondary screening assay. Eact (10 µM, shown in blue) was used as positive control (n = 4 independent donors; F508del/F508del, F508del/F508del, F508del/W846X, 1811G+1>C/1811+1G>C, 1–3 replicates per donor); (C) representative brightfield images showing automatic recognition of nasal organoids (CF: 1811+1G>C/1811+1G>C) using the OrgaQuant model [18]. Examples are shown from a well containing DMSO as negative control (upper panel) and a well containing FDA hit compounds (lower panel); (D) graphs show percentage change in surface area relative to t = 0 (100%) of individual organoids, treated with vehicle DMSO (left panel) or FDA hit compounds (right panel), corresponding to the organoids shown in (C). Each line represents an individual organoid; (E) quantification of swell rates of individual organoids from the example wells shown in (C,D). Analysis of differences was performed using an unpaired t-test (E). **** p < 0.0001.
Figure 3
Figure 3
Primary screening assay of an FDA-approved drug library in CF nasal organoids. (A) ~1400 FDA-approved drugs (3 µM) were screened in a 384-well plate format in nasal organoids from 4 pwCF. Two compounds were combined in a single well; (B) the graph represents mean plate-normalized swell rates of four CF donors. A total of 90 compounds (shown in green), divided over 45 wells, with a plate-normalized swell rate above 1 IQR above the median were selected from the primary screening assay for the secondary screening assay. Eact (10 µM, shown in blue) was used as positive control (n = 4 independent donors; F508del/F508del, F508del/F508del, F508del/W846X, 1811G+1>C/1811+1G>C, 1–3 replicates per donor); (C) representative brightfield images showing automatic recognition of nasal organoids (CF: 1811+1G>C/1811+1G>C) using the OrgaQuant model [18]. Examples are shown from a well containing DMSO as negative control (upper panel) and a well containing FDA hit compounds (lower panel); (D) graphs show percentage change in surface area relative to t = 0 (100%) of individual organoids, treated with vehicle DMSO (left panel) or FDA hit compounds (right panel), corresponding to the organoids shown in (C). Each line represents an individual organoid; (E) quantification of swell rates of individual organoids from the example wells shown in (C,D). Analysis of differences was performed using an unpaired t-test (E). **** p < 0.0001.
Figure 4
Figure 4
Secondary screening assay and validation of FDA hit compounds in CFTR-null donors. (A) A total of 90 hit compounds identified in the primary screening assay were further validated in the conventional 96-well plate format with one compound per well; (B) the graph represents mean plate-normalized swell rates of four donors. Hit compounds were selected based on swell rate and working mechanism (n = 4 independent donors; F508del/F508del, F508del/F508del, F508del/W846X, 1811G+1>C/1811+1G>C, 3 replicates per donor); (C) overview of the 12 hit compounds with their working mechanism, disease application and ranking in the secondary screening assay; (D) the 12 hit compounds were further evaluated in an organoid swelling assay with CFTR-null nasal organoids (n = 3 independent donors: G542X/CFTRdele2.3(21kb), W1282X/1717-1G>A, R553X/R553X, n = 2–7 measurements per donor). The compounds are ranked based on their effect size in the secondary screening assay, shown in (B). The conventional image analysis was applied using fluorescent-labeled organoids. Organoid swelling is shown as AUC values from measurements of 120 min; (E) representative confocal images of CFTR-null (R553X/R553X) nasal organoids, stimulated with Terbutaline Sulfate or Alprostadil (both 3 µM) as example of two hit compounds at 0 and 120 min. (F) Quantification of CFTR-null (R553X/R553X) nasal organoid swelling after stimulation with Terbutaline Sulfate or Alprostadil (both 3 µM). Differences with baseline are analyzed using a one-way ANOVA with Dunnett’s post hoc test (D). ns = non-significant, ** p < 0.01, *** p < 0.001, **** p < 0.0001.
Figure 4
Figure 4
Secondary screening assay and validation of FDA hit compounds in CFTR-null donors. (A) A total of 90 hit compounds identified in the primary screening assay were further validated in the conventional 96-well plate format with one compound per well; (B) the graph represents mean plate-normalized swell rates of four donors. Hit compounds were selected based on swell rate and working mechanism (n = 4 independent donors; F508del/F508del, F508del/F508del, F508del/W846X, 1811G+1>C/1811+1G>C, 3 replicates per donor); (C) overview of the 12 hit compounds with their working mechanism, disease application and ranking in the secondary screening assay; (D) the 12 hit compounds were further evaluated in an organoid swelling assay with CFTR-null nasal organoids (n = 3 independent donors: G542X/CFTRdele2.3(21kb), W1282X/1717-1G>A, R553X/R553X, n = 2–7 measurements per donor). The compounds are ranked based on their effect size in the secondary screening assay, shown in (B). The conventional image analysis was applied using fluorescent-labeled organoids. Organoid swelling is shown as AUC values from measurements of 120 min; (E) representative confocal images of CFTR-null (R553X/R553X) nasal organoids, stimulated with Terbutaline Sulfate or Alprostadil (both 3 µM) as example of two hit compounds at 0 and 120 min. (F) Quantification of CFTR-null (R553X/R553X) nasal organoid swelling after stimulation with Terbutaline Sulfate or Alprostadil (both 3 µM). Differences with baseline are analyzed using a one-way ANOVA with Dunnett’s post hoc test (D). ns = non-significant, ** p < 0.01, *** p < 0.001, **** p < 0.0001.
Figure 5
Figure 5
Generation and validation of TMEM16A KO nasal epithelial cells. CRISPR-Cas9 based gene editing was used to generate a TMEM16A KO in CFTR-null nasal cells. (A) Graphical overview showing binding sites of three sgRNA molecules and Sanger sequencing traces after electroporation; (B) DNA gel showing the PCR-amplified products of the targeted TMEM16A locus for KO and control samples of 3 CFTR-null donors (G542X/CFTRdele2.3 (21 kb), W1282X/1717-1G>A, R553X/R553X). Predicted length of the PCR product was 613 bp; (C) representative Western blot for TMEM16A protein of ALI-differentiated TMEM16A KO and control cells. To increase TMEM16A expression, some cells were treated with IL-4 for 48 h; (D) quantified band intensity of TMEM16A protein in Western blots (n = 3 independent donors); (E) functional validation of ALI-differentiated TMEM16A KO cells with Ussing chamber measurements. TMEM16A activity was determined based on Ani9-sensitive (1 µM) UTP-induced (100 µM) currents. Representative traces are shown of one donor and (F) UTP-induced currents were quantified for all donors, with and without Ani9-treatment (n = 3 independent donors). All cells were treated with amiloride and indicated cells were treated with IL-4 for 48 h. Analysis of differences was performed using paired t-tests (D) or a 2-way ANOVA with Tukey post hoc test (F). ns = non-significant, * p < 0.05, *** p < 0.001, **** p < 0.0001.
Figure 5
Figure 5
Generation and validation of TMEM16A KO nasal epithelial cells. CRISPR-Cas9 based gene editing was used to generate a TMEM16A KO in CFTR-null nasal cells. (A) Graphical overview showing binding sites of three sgRNA molecules and Sanger sequencing traces after electroporation; (B) DNA gel showing the PCR-amplified products of the targeted TMEM16A locus for KO and control samples of 3 CFTR-null donors (G542X/CFTRdele2.3 (21 kb), W1282X/1717-1G>A, R553X/R553X). Predicted length of the PCR product was 613 bp; (C) representative Western blot for TMEM16A protein of ALI-differentiated TMEM16A KO and control cells. To increase TMEM16A expression, some cells were treated with IL-4 for 48 h; (D) quantified band intensity of TMEM16A protein in Western blots (n = 3 independent donors); (E) functional validation of ALI-differentiated TMEM16A KO cells with Ussing chamber measurements. TMEM16A activity was determined based on Ani9-sensitive (1 µM) UTP-induced (100 µM) currents. Representative traces are shown of one donor and (F) UTP-induced currents were quantified for all donors, with and without Ani9-treatment (n = 3 independent donors). All cells were treated with amiloride and indicated cells were treated with IL-4 for 48 h. Analysis of differences was performed using paired t-tests (D) or a 2-way ANOVA with Tukey post hoc test (F). ns = non-significant, * p < 0.05, *** p < 0.001, **** p < 0.0001.
Figure 6
Figure 6
Hit compound validation in TMEM16A KO nasal organoids. (A) Brightfield images showing intrinsic lumen formation, without any stimulation, in both control and TMEM16A KO nasal organoids (G542X/CFTRdele2.3(21kb)); (B) quantification of organoid lumen size in control and knockout organoids (n = 3 independent donors); (C) validation of hit compounds on nasal organoid swelling in TMEM16A KO and control organoids (n = 3 independent donors, 2–6 measurements per donor); (D) representative confocal images (G542X/CFTRdele2.3 (21 kb)) of TMEM16A KO and control nasal organoids, stimulated with Terbutaline Sulfate (3 µM) as example of one of the hit compounds; (E) quantification of nasal organoid swelling after stimulation with Terbutaline Sulfate (3 µM) in TMEM16A KO and control organoids (n = 3 independent donors). Analysis of difference was performed with a paired (B) or unpaired (C) t-test. No significant results were found. Ns = non-significant.
Figure 7
Figure 7
Effect of the hit compounds on TMEM16A in other in vitro model systems. (A) The effect of the hit compounds (3 µM) on chloride conductance was determined in Ussing chamber measurements with ALI-differentiated CFTR-null nasal cells (n = 3 independent donors; each compound was measured in at least 2 different donors; n = 1–6 measurements per donor). No significant differences were found between one of the compounds and DMSO; (B) assessment whether the hit compounds (3 µM) enhance UTP-induced currents in Ussing chamber measurements. Experiments were conducted by stimulating different concentrations of UTP with hit compounds in ALI-differentiated CFTR-null nasal cells (n = 3 independent donors, each compound was measured in at least 2 different donors; n = 2–3 measurements per donor). No significant results were found between one of the compounds and DMSO, for any concentration of UTP; (C,D) effect of the 12 hit compounds (3 µM) on ionomycin-induced (1 µM) iodide influx was assessed with an YFP-quenching assay in CFBE cells. TMEM16A-dependency was demonstrated with sensitivity for Ani9 (3 and 10 uM, shown in red). DMSO was used as negative control (shown in green) and Eact (3 and 10 µM) as positive control (shown in blue). For quantification, quenching rates were normalized to the control; (E,F) effect of a selection of 6 hit compounds (3 µM) on ATP-induced (5 µM) iodide influx was analyzed in HT-29-YFP cells. TMEM16A-dependency was demonstrated with sensitivity for Ani9 (10 uM, shown in red) and DMSO was used as negative control (shown in green). For quantification, quenching rates were normalized to the control. Analysis of differences were performed with one-way ANOVA and Dunnett’s post hoc test (A,D,F) or a two-way ANOVA with Dunnett’s post hoc test (B). ** p < 0.01, **** p < 0.0001.
Figure 7
Figure 7
Effect of the hit compounds on TMEM16A in other in vitro model systems. (A) The effect of the hit compounds (3 µM) on chloride conductance was determined in Ussing chamber measurements with ALI-differentiated CFTR-null nasal cells (n = 3 independent donors; each compound was measured in at least 2 different donors; n = 1–6 measurements per donor). No significant differences were found between one of the compounds and DMSO; (B) assessment whether the hit compounds (3 µM) enhance UTP-induced currents in Ussing chamber measurements. Experiments were conducted by stimulating different concentrations of UTP with hit compounds in ALI-differentiated CFTR-null nasal cells (n = 3 independent donors, each compound was measured in at least 2 different donors; n = 2–3 measurements per donor). No significant results were found between one of the compounds and DMSO, for any concentration of UTP; (C,D) effect of the 12 hit compounds (3 µM) on ionomycin-induced (1 µM) iodide influx was assessed with an YFP-quenching assay in CFBE cells. TMEM16A-dependency was demonstrated with sensitivity for Ani9 (3 and 10 uM, shown in red). DMSO was used as negative control (shown in green) and Eact (3 and 10 µM) as positive control (shown in blue). For quantification, quenching rates were normalized to the control; (E,F) effect of a selection of 6 hit compounds (3 µM) on ATP-induced (5 µM) iodide influx was analyzed in HT-29-YFP cells. TMEM16A-dependency was demonstrated with sensitivity for Ani9 (10 uM, shown in red) and DMSO was used as negative control (shown in green). For quantification, quenching rates were normalized to the control. Analysis of differences were performed with one-way ANOVA and Dunnett’s post hoc test (A,D,F) or a two-way ANOVA with Dunnett’s post hoc test (B). ** p < 0.01, **** p < 0.0001.

References

    1. Riordan J.R., Rommens J.M., Kerem B.S., Alon N.O.A., Rozmahel R., Grzelczak Z., Zielenski J., Lok S.I., Plavsic N., Chou J.L., et al. Identification of the Cystic Fibrosis Gene: Cloning and Characterization of Complementary DNA. Science. 1989;245:1066–1073. doi: 10.1126/science.2475911. - DOI - PubMed
    1. Coakley R.D., Grubb B.R., Paradiso A.M., Gatzy J.T., Johnson L.G., Kreda S.M., O’Neal W.K., Boucher R.C. Abnormal Surface Liquid PH Regulation by Cultured Cystic Fibrosis Bronchial Epithelium. Proc. Natl. Acad. Sci. USA. 2003;100:16083–16088. doi: 10.1073/pnas.2634339100. - DOI - PMC - PubMed
    1. Elborn J.S. Cystic Fibrosis. Lancet. 2016;388:2519–2531. doi: 10.1016/S0140-6736(16)00576-6. - DOI - PubMed
    1. Middleton P.G., Mall M.A., Dřevínek P., Lands L.C., McKone E.F., Polineni D., Ramsey B.W., Taylor-Cousar J.L., Tullis E., Vermeulen F., et al. Elexacaftor-Tezacaftor-Ivacaftor for Cystic Fibrosis with a Single Phe508del Allele. N. Engl. J. Med. 2019;381:1809–1819. doi: 10.1056/NEJMoa1908639. - DOI - PMC - PubMed
    1. Heijerman H.G.M., McKone E.F., Downey D.G., Van Braeckel E., Rowe S.M., Tullis E., Mall M.A., Welter J.J., Ramsey B.W., McKee C.M., et al. Efficacy and Safety of the Elexacaftor plus Tezacaftor plus Ivacaftor Combination Regimen in People with Cystic Fibrosis Homozygous for the F508del Mutation: A Double-Blind, Randomised, Phase 3 Trial. Lancet. 2019;394:1940–1948. doi: 10.1016/S0140-6736(19)32597-8. - DOI - PMC - PubMed

MeSH terms

Substances