. 2022 Oct 21;23(20):12695.
doi: 10.3390/ijms232012695.

Role of Glycolysis and Fatty Acid Synthesis in the Activation and T Cell-Modulating Potential of Dendritic Cells Stimulated with a TLR5-Ligand Allergen Fusion Protein

Affiliations

Role of Glycolysis and Fatty Acid Synthesis in the Activation and T Cell-Modulating Potential of Dendritic Cells Stimulated with a TLR5-Ligand Allergen Fusion Protein

Alexandra Goretzki et al. Int J Mol Sci. .

Abstract

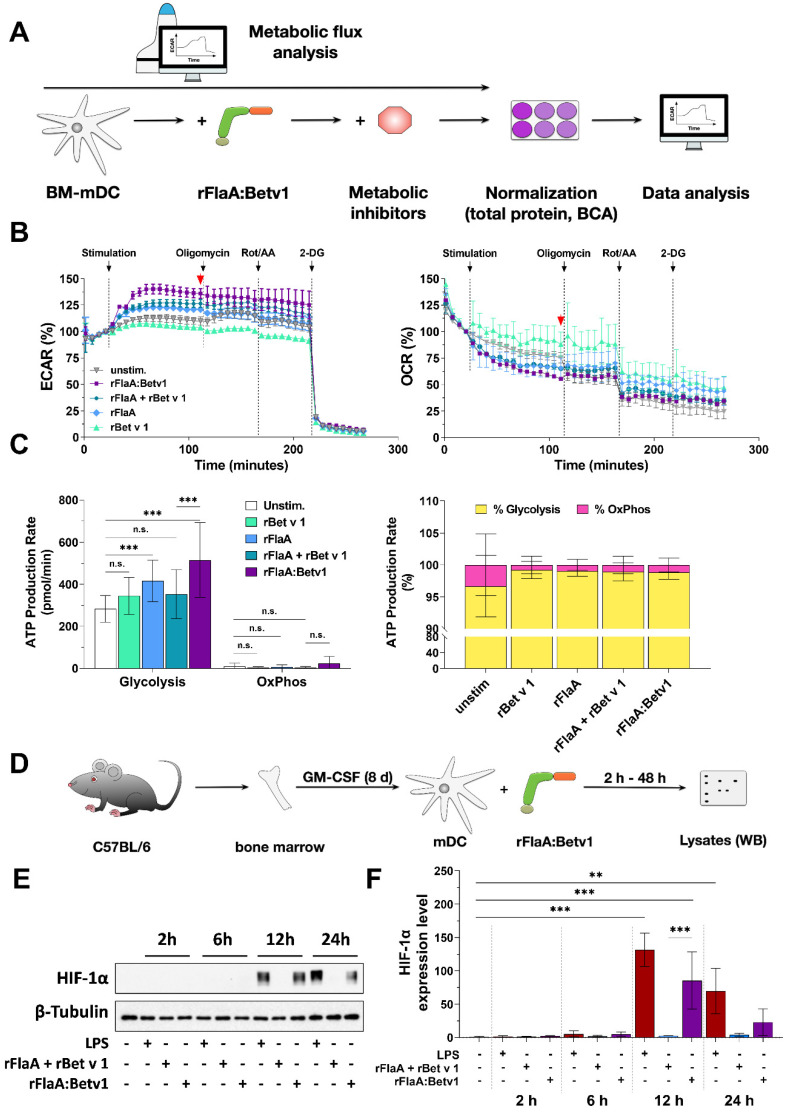
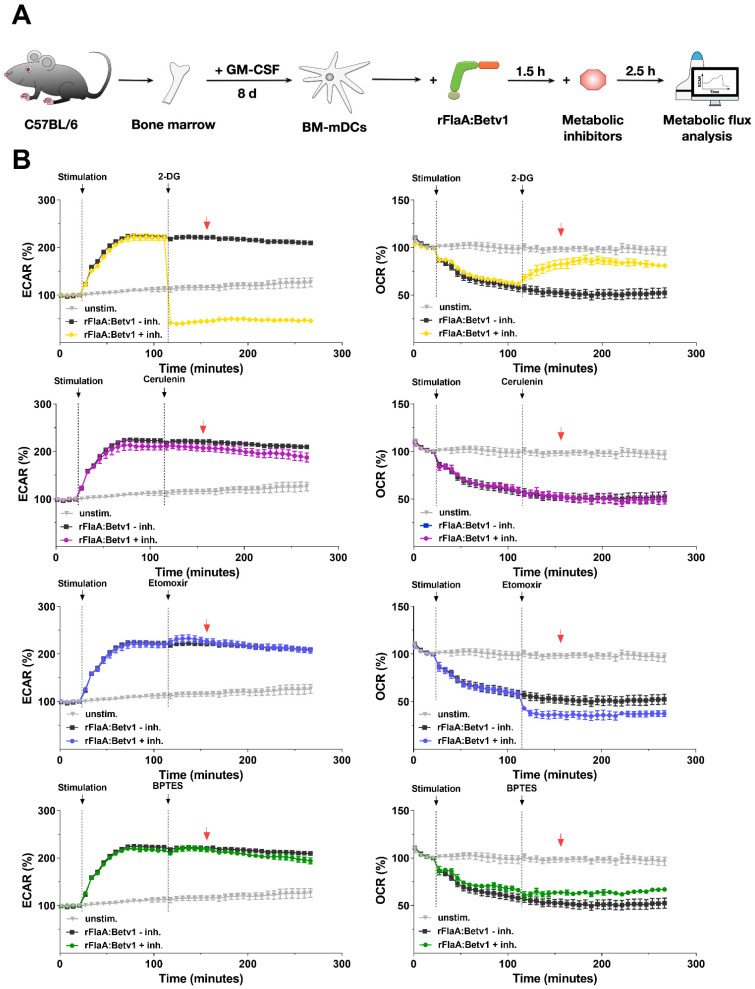
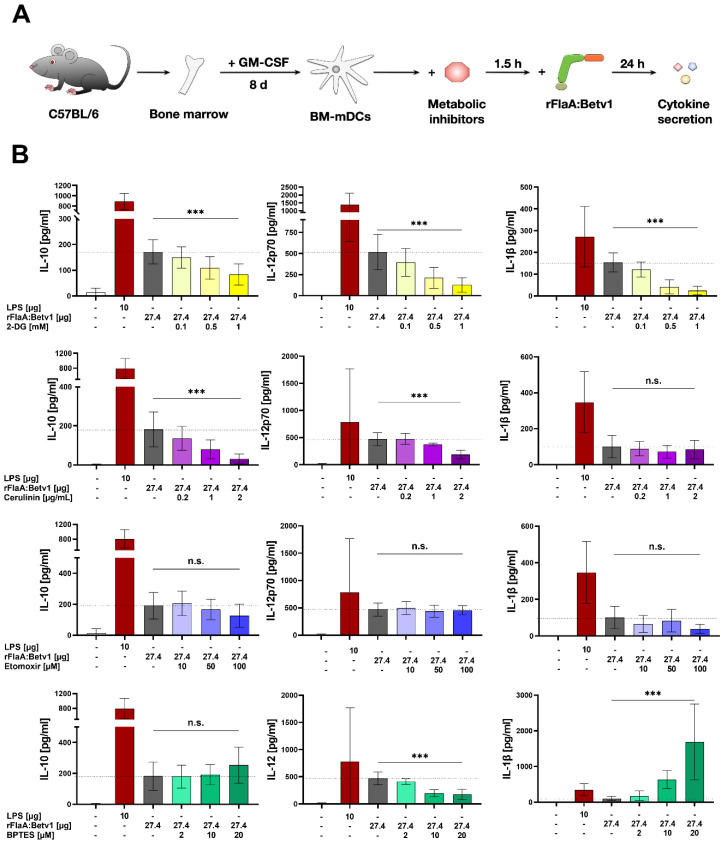
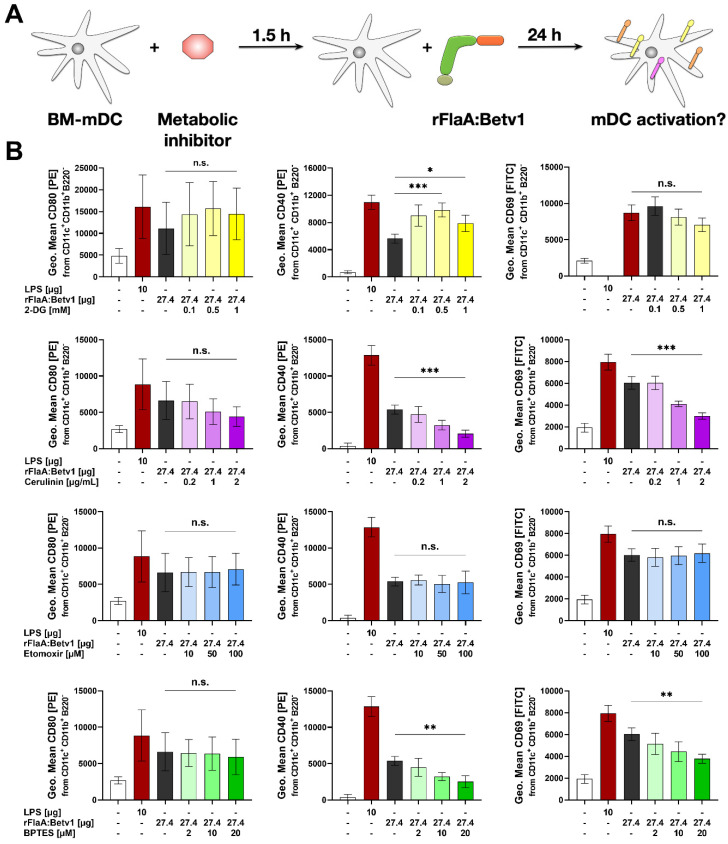
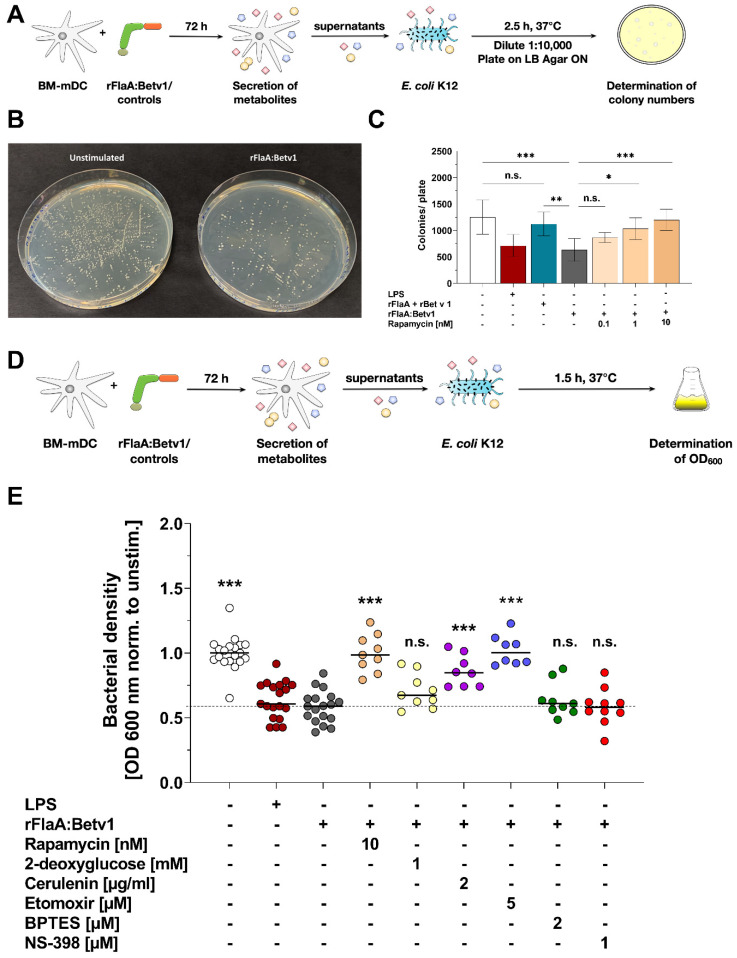
Trained immune responses, based on metabolic and epigenetic changes in innate immune cells, are de facto innate immune memory and, therefore, are of great interest in vaccine development. In previous studies, the recombinant fusion protein rFlaA:Betv1, combining the adjuvant and toll-like receptor (TLR)5-ligand flagellin (FlaA) and the major birch pollen allergen Bet v 1 into a single molecule, significantly suppressed allergic sensitization in vivo while also changing the metabolism of myeloid dendritic cells (mDCs). Within this study, the immune-metabolic effects of rFlaA:Betv1 during mDC activation were elucidated. In line with results for other well-characterized TLR-ligands, rFlaA:Betv1 increased glycolysis while suppressing oxidative phosphorylation to different extents, making rFlaA:Betv1 a suitable model to study the immune-metabolic effects of TLR-adjuvanted vaccines. In vitro pretreatment of mDCs with cerulenin (inhibitor of fatty acid biosynthesis) led to a decrease in both rFlaA:Betv1-induced anti-inflammatory cytokine Interleukin (IL) 10 and T helper cell type (TH) 1-related cytokine IL-12p70, while the pro-inflammatory cytokine IL 1β was unaffected. Interestingly, pretreatment with the glutaminase inhibitor BPTES resulted in an increase in IL-1β, but decreased IL-12p70 secretion while leaving IL-10 unchanged. Inhibition of the glycolytic enzyme hexokinase-2 by 2-deoxyglucose led to a decrease in all investigated cytokines (IL-10, IL-12p70, and IL-1β). Inhibitors of mitochondrial respiration had no effect on rFlaA:Betv1-induced IL-10 level, but either enhanced the secretion of IL-1β (oligomycin) or decreased IL-12p70 (antimycin A). In extracellular flux measurements, mDCs showed a strongly enhanced glycolysis after rFlaA:Betv1 stimulation, which was slightly increased after respiratory shutdown using antimycin A. rFlaA:Betv1-stimulated mDCs secreted directly antimicrobial substances in a mTOR- and fatty acid metabolism-dependent manner. In co-cultures of rFlaA:Betv1-stimulated mDCs with CD4+ T cells, the suppression of Bet v 1-specific TH2 responses was shown to depend on fatty acid synthesis. The effector function of rFlaA:Betv1-activated mDCs mainly relies on glycolysis, with fatty acid synthesis also significantly contributing to rFlaA:Betv1-mediated cytokine secretion, the production of antimicrobial molecules, and the modulation of T cell responses.

Keywords: Bet v 1; Warburg; allergy; flagellin; fusion protein; immune metabolism.


Conflict of interest statement

AG reports price money received from the German Society of Allergy and Clinical Immunology (DGAKI) and the Organizing Committee of the World Immune Regulation Meeting (WIRM) for abstracts and presentations relating to this publication. All other authors have no conflict of interest to declare.

Figures

Figure 1
Figure 1
rFlaA:Betv1 induces a pronounced switch towards glycolysis in stimulated mDCs. C57Bl/6J mDCs were stimulated with equimolar concentrations of either rFlaA + rBet v 1 or rFlaA:Betv1 (equimolar to 4 µg/mL of rBet v 1) or 100 ng/mL LPS as a positive control and analyzed for extracellular acidification rates (ECAR) and oxygen consumption rates (OCR) using Seahorse technology (A). 14 cycles (84 min) post-stimulation, ATP synthase, the electron transport chain, and glycolysis were inhibited by sequential injection of oligomycin, rotenone/antimycin A (Rot/AA), and 2-deoxy-glucose (2-DG), for eight cycles (48 min) each, respectively. The red arrow indicates the time point used for statistical analyses in Repos. Figure S3 (for more information, see text) (B). Levels of glycolytic- and mitochondrial ATP-production, glycolysis, and oxidative phosphorylation (OxPhos) were analyzed by metabolic flux assay using the “ATP rate assay” according to the manufacturer’s recommendations (C). For HIF-1α detection, mDCs were stimulated with either 10 µg/mL of LPS, 17.4 µg/mL of rFlaA + 10 µg/mL rBet v 1, or 27.4 µg/mL rFlaA:Betv1 for the indicated time points and analyzed via Western Blot (D,E). Expression levels were first normalized to the β-tubulin loading control, followed by normalization to unstimulated controls (F). Data are either representative results of three independent experiments that showed similar results (B,C,E) or results of three independent experiments (F). Statistical comparisons were performed by 2-way ANOVA with correction for multiple comparisons according to Turkey and indicated as: n.s. p-value > 0.05, ** p-value < 0.01, *** p-value < 0.001.
Figure 2
Figure 2
The rFlaA:Betv1-induced increase in ECAR depends on glucose metabolism. mDCs were stimulated with 11 µg/mL rFlaA:Betv1 for 14 cycles (84 min) followed by injection of the different inhibitors (2-DG: 50 mM, cerulenin: 2 µg/mL, etomoxir: 100 µM, BPTES: 20 µM) for another 24 cycles (144 min) and continuously analyzed for extracellular acidification rates (ECAR) and oxygen consumption rates (OCR) using Seahorse technology (A). Data are representative results of three independent experiments that showed similar results, with three to four technical replicates per experiment (B). The red arrow indicates the time point chosen for statistical analysis shown in Repos. Figure S5 (for more information, see text).
Figure 3
Figure 3
rFlaA:Betv1-induced IL-10 secretion from mDCs depends on glycolytic metabolism and fatty acid synthesis. mDCs were pretreated for 90 min with the indicated inhibitor concentrations followed by stimulation with 27.4 µg/mL of rFlaA:Betv1 for 24 h (A). Supernatants were analyzed for cytokine secretion by ELISA. Data are mean results of three to four independent experiments (B). Statistical comparisons were performed by 2-way ANOVA with correction for multiple comparisons according to Tukey and indicated as: n.s. p-value > 0.05, or *** p-value < 0.001. Please note that data shown in Figure 4 and Figure 5 were generated using the same mDC preparations.
Figure 4
Figure 4
Glycolysis, fatty acid synthesis, and amino acid metabolism contribute to rFlaA:Betv1-induced expression of co-stimulatory molecules. mDCs were pretreated for 90 min with the indicated inhibitor concentrations, followed by stimulation with 27.4 µg/mL of rFlaA:Betv1 for 24 h (A). Cells were harvested, and surface expression of the indicated co-stimulatory molecules was quantified as geometric mean fluorescence intensities (MFI) by flow cytometry. Data are results of three to four independent experiments (B). Statistical comparisons were performed by 2-way ANOVA with correction for multiple comparisons according to Turkey and indicated as: n.s. p-value > 0.05, * p-value < 0.05, ** p-value < 0.01, or *** p-value < 0.001.
Figure 5
Figure 5
rFlaA:Betv1 triggers a mTOR- and fatty acid metabolism-dependent secretion of antimicrobial factors from stimulated mDCs. E. coli K12 cultures were incubated for 2.5 h with supernatants derived from mDCs stimulated as indicated and plated overnight on agar plates (A). Bacterial growth was documented photographically (B) and colony numbers were counted manually (C). Bacterial growth in liquid cultures was determined photometrically by measuring the OD600nm 1.5 h post-addition of the indicated supernatants (D,E). Data are either representative results of four independent experiments that showed similar results (B) or results of three to four independent experiments (C,E). Statistical comparisons were performed by 2-way ANOVA with correction for multiple comparisons according to Turkey and indicated as: n.s. p-value > 0.05, * p-value < 0.05, ** p-value < 0.01, or *** p-value < 0.001.
Figure 6
Figure 6
Fatty acid metabolism contributes to the T cell modulating properties of rFlaA:Betv1-stimulated mDCs. BALB/c mDCs were co-cultured with CD4+ T cells isolated from spleens of BALB/c mice that were previously immunized with the major birch pollen allergen Bet v 1 and alum. Prior to co-cultures, mDCs were pretreated for 16 h with metabolic inhibitors (5 nM rapamycin, 0.5 mM 2-DG, 1 µM BPTES, or 0.2 µg/mL cerulenin), then the medium was changed. mDCs were either left alone (solid bars) or T cells were added (bars with dotted pattern). Cultures were either left unstimulated or re-stimulated with either 2 µg/mL Bet v 1 with and without the addition of equimolar amounts of either rFlaA:Betv1 or rFlaA+Betv1 for additional 70 h (A). Cytokine secretion was determined for IL-2, IL-10, IL-5, and IFN-γ (B). Data are mean results of four independent experiments±SD. Statistical comparisons were performed by 2-way ANOVA with correction for multiple comparisons according to Dunnett and indicated as: n.s. p-value > 0.05, * p-value < 0.05, ** p-value < 0.01, or *** p-value < 0.001.

References

    1. Goretzki A., Zimmermann J., Lin Y.-J., Schülke S. Immune Metabolism–An Opportunity to Better Understand Allergic Pathology and Improve Treatment of Allergic Diseases? Front. Allergy. 2022;3:825931. doi: 10.3389/falgy.2022.825931. - DOI - PMC - PubMed
    1. Netea M.G., Domínguez-Andrés J., Barreiro L.B., Chavakis T., Divangahi M., Fuchs E., Joosten L.A.B., van der Meer J.W.M., Mhlanga M.M., Mulder W.J.M., et al. Defining Trained Immunity and Its Role in Health and Disease. Nat. Rev. Immunol. 2020;20:375–388. doi: 10.1038/s41577-020-0285-6. - DOI - PMC - PubMed
    1. Schülke S., Fiedler A.-H., Junker A.-C., Flaczyk A., Wolfheimer S., Wangorsch A., Heinz A., Beckert H., Nagl B., Bohle B., et al. Critical Role of Mammalian Target of Rapamycin for IL-10 Dendritic Cell Induction by a Flagellin A Conjugate in Preventing Allergic Sensitization. J. Allergy Clin. Immunol. 2018;141:1786–1798.e11. doi: 10.1016/j.jaci.2017.07.002. - DOI - PubMed
    1. Moeller T., Wolfheimer S., Goretzki A., Scheurer S., Schülke S. NFκB- and MAP-Kinase Signaling Contribute to the Activation of Murine Myeloid Dendritic Cells by a Flagellin A:Allergen Fusion Protein. Cells. 2019;8:355. doi: 10.3390/cells8040355. - DOI - PMC - PubMed
    1. Lin Y.-J., Papp G., Miskey C., Fiedler A., Goretzki A., Wolfheimer S., Zimmermann J., Crauwels P., Ivics Z., van Zandbergen G., et al. The Flagellin:Allergen Fusion Protein RFlaA:Betv1 Induces a MyD88- and MAPK-Dependent Activation of Glucose Metabolism in Macrophages. Cells. 2021;10:2614. doi: 10.3390/cells10102614. - DOI - PMC - PubMed

MeSH terms