. 2022 Oct 13;19(20):13163.
doi: 10.3390/ijerph192013163.

The Lesson Learned from the COVID-19 Pandemic: Can an Active Chemical Be Effective, Safe, Harmless-for-Humans and Low-Cost at a Time? Evidence on Aerosolized Hypochlorous Acid

Affiliations

The Lesson Learned from the COVID-19 Pandemic: Can an Active Chemical Be Effective, Safe, Harmless-for-Humans and Low-Cost at a Time? Evidence on Aerosolized Hypochlorous Acid

Mascia Benedusi et al. Int J Environ Res Public Health. .

Abstract

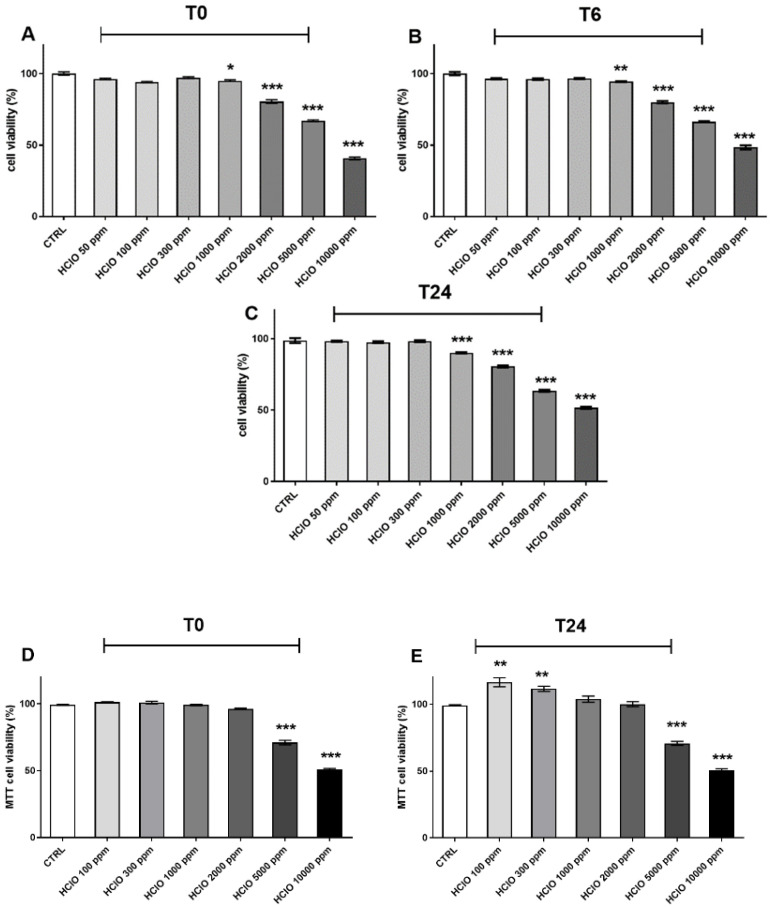
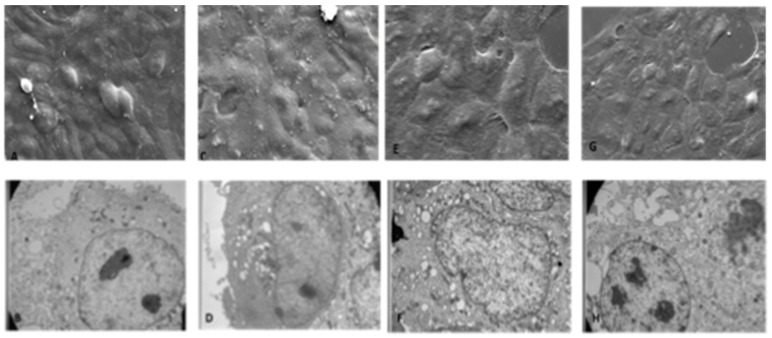
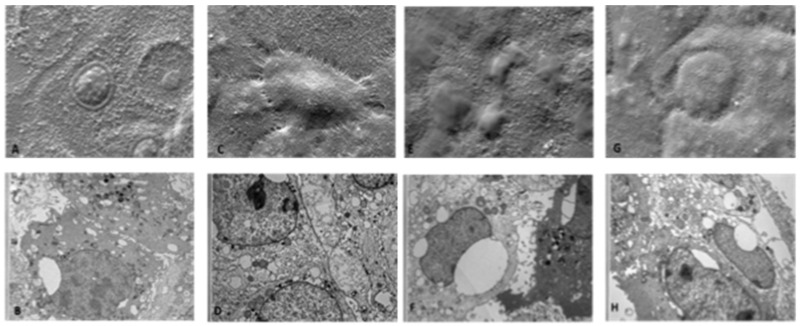
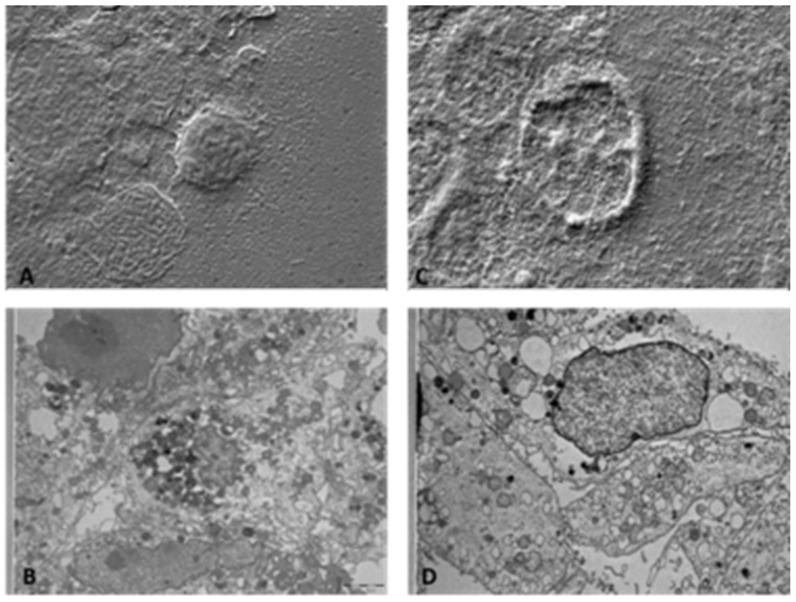
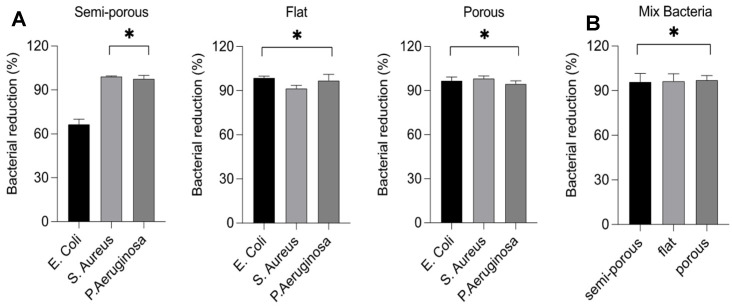
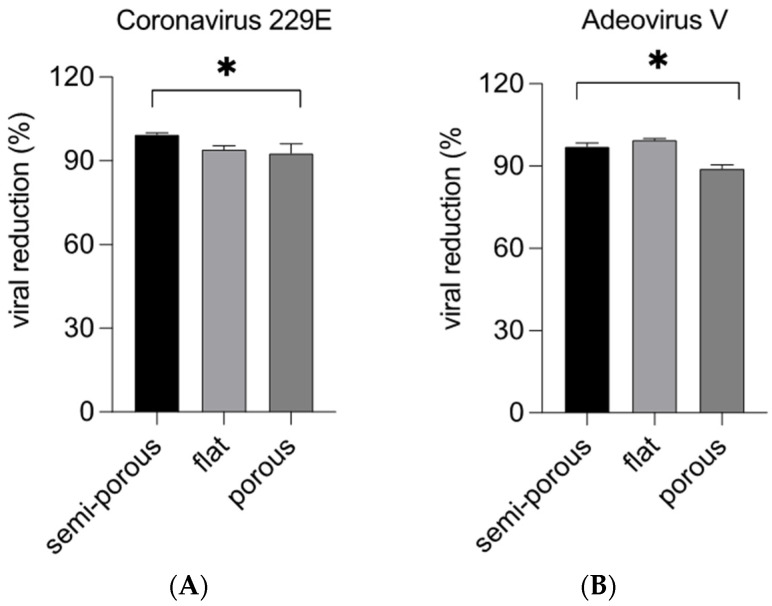
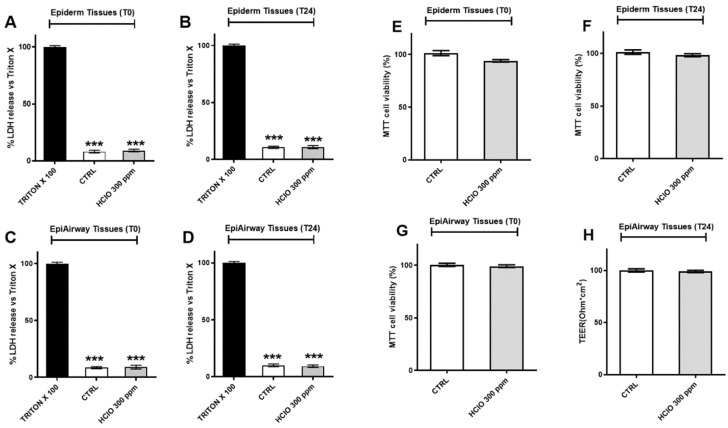
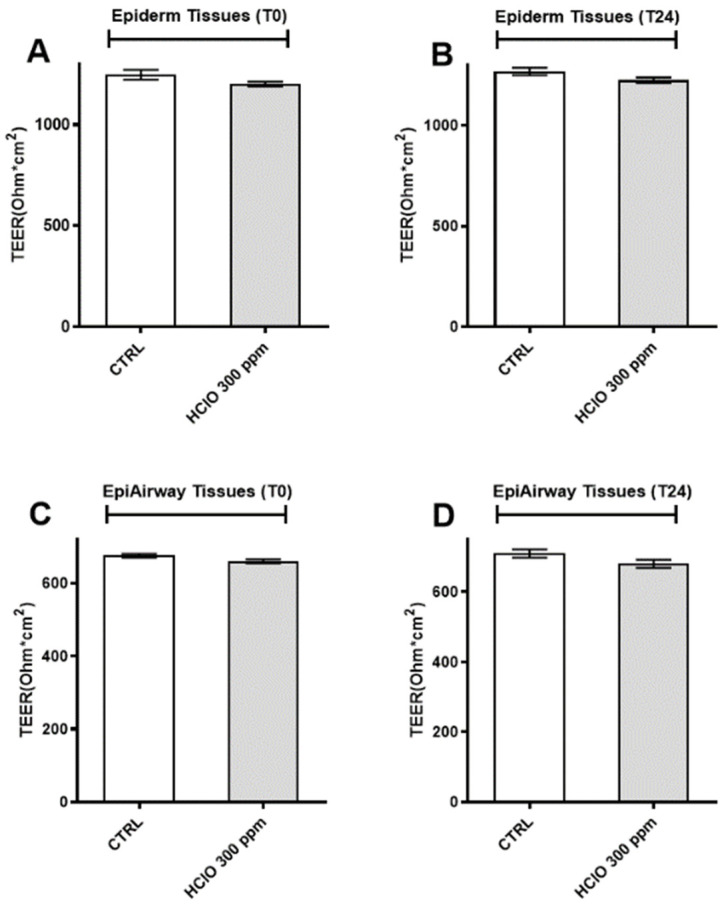
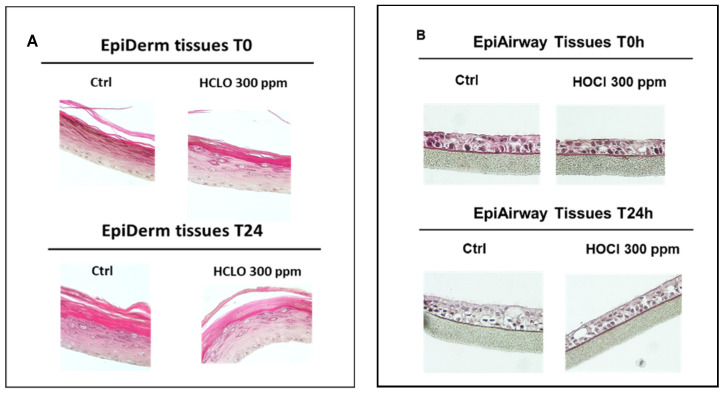
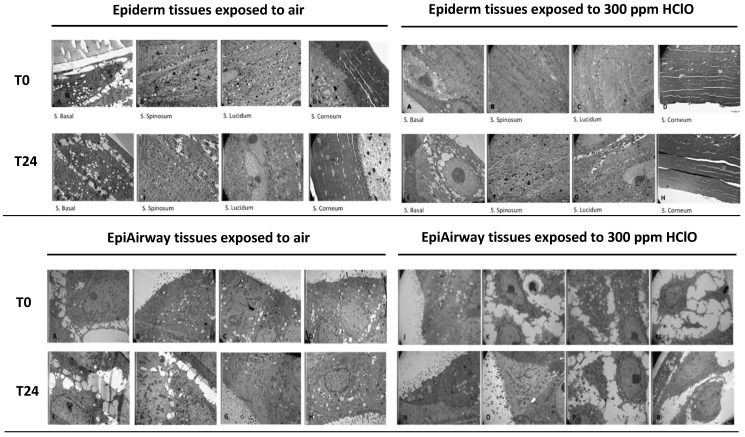
The COVID-19 pandemic has underlined the importance of disinfectants as tools to prevent and fight against coronavirus spreading. An ideal disinfectant and sanitizer must be nontoxic to surface contact, noncorrosive, effective, and relatively inexpensive as it is hypochlorous acid (HOCl). The present work intended to evaluate, on different surfaces, the bactericidal and virucidal effectiveness of nebulized HOCl and test its safety usage in 2D and 3D skin and lung models. Our data showed that HOCl at the dose of 300 ppm did not affect cellular and tissue viability, not their morphology. The HOCl bactericidal properties varies with the surface analyzed: 69% for semi-porous, 96-99.9% for flat and porous. This discrepancy was not noticed for the virucidal properties. Overall, this study showed that nebulized HOCl can prevent virus and bacteria growth without affecting lung and skin tissues, making this compound a perfect candidate to sanitize indoor environments.

Keywords: COVID-19 pandemic; bactericidal; hypochlorous acid; indoor sanitization; virucidal.


Conflict of interest statement

The authors declare no conflict of interest.

Figures

Figure 1
Figure 1
Effects of HOCl nebulization on HaCaT cell proliferation and viability; after the nebulization of different doses of HOCl, cells were collected immediately after the exposure and after 6 or 24 h. Cell viability was assessed by Trypan blue exclusion test (upper panels, AC) and MTT assay (below panels, D,E). Data are expressed as mean ± SEM of four different experiments. * p < 0.05; ** p < 0.01; *** p < 0.0001 exposed vs. CTRL. Results were analyzed by One-way ANOVA.
Figure 2
Figure 2
Effects of 100 ppm HOCl nebulization on HaCaT cells morphology analyzed by SEM and TEM microscopies. (A) Ctrl T0h; SEM image: morphologically normal cells, in tightly adhered uniform monolayer. (B) Ctrl T0h; TEM image: structurally unaltered nuclei and organelles, low percentage of vacuolated cells. (C) Ctrl T24h; SEM image: after 24 h the cellular carpet surface remains uniform without variations. (D) Ctrl T24h; TEM image: cells have normal cytoplasmic and nuclear structures. (E) 100 ppm T0h; SEM image: cells morphologically unchanged compared to controls, in monolayer it remains uniform. (F) 100 ppm T0h TEM image: the treatment at this concentration does not alter the cellular structure which remains the same as that observed in the controls. (G) 100 ppm T24h; SEM image: after 24 h the cellular carpet surface is still uniform. (H) 100ppm T24h; TEM image: cells have cytoplasmic and nuclear structure without relevant alterations. 5K magnification (SEM pictures) and 10K Magnification (TEM pictures).
Figure 3
Figure 3
Effects of 300 and 5000 ppm HOCl nebulization on HaCaT cell morphology analyzed by SEM and TEM microscopies. (A) SEM image: T0h 300 ppm: SEM images show some cells with pycnotic nuclei and expanded cytoplasm in contact with neighboring cells. (B) TEM image T24h 300 ppm: the photomicrograph below at the same magnification shows cells with some vacuolations and lysosomal vesicles. (C) SEM image: T24h 300 ppm: SEM images show cells that tend to lose adhesion from contact with neighboring cells, rising from the underlying carpet. (D) TEM image T24h 300 ppm: cells with extensive vacuolization, cytoplasmic degranulation and structural loss of organelles are shown. (E) SEM image T0h 5000 ppm: the diffuse presence of surface alterations of the membrane appears on the scan. (F) TEM image T0h 5000 ppm: the vast vacuolization, the structural alteration of the mitochondria and the presence of a significant number of lysosomal and peroxisomal vesicles. (G) SEM image T24h 5000 ppm: the cells appear disrupted and with loss of adhesion. (H) TEM image T24h 5000 ppm: confirms the presence of a high percentage of cells in necrosis, pycnotic nuclei and cytoplasmic disaggregation. 5K magnification (for both SEM and TEM pictures).
Figure 4
Figure 4
Effects of 10,000 ppm HOCl nebulization on HaCaT cell morphology analyzed by SEM and TEM microscopies. (A) SEM imageT0h 10,000 ppm: at maximum conc. of the SEM treatment the cells appear disrupted and with loss of adhesion. (B) TEM image T0h 10,000 ppm: confirms the presence of a high percentage of necrotic, pycnotic nuclei and cytoplasmic disaggregation. (C) SEM image T24h 10,000 ppm: at this conc. at SEM the cells appear deeply damaged with loss of both cytoplasm and nuclear support. (D) TEM image T24h 10,000 ppm: confirms the presence of a widespread percentage of cells in necrosis, pycnotic nuclei and disaggregation of cytoplasm, and there are numerous cells in apoptosis. 5K magnification (for both SEM and TEM pictures).
Figure 5
Figure 5
Bactericidal effect of HOCl solution at 300 ppm against E. coli, S. aureus and P. aeruginosa 1 × 10⁶ CFU/mL. The bacteria were incubated in the different surfaces—semi porous, flat and porous. Data represent the percentage of bacterial reduction after 10 min of exposition of nebulization. (Panel A) shows the single reduction of microbial growth on different surfaces, while (panel B) shows the reduction growth of a mix of microorganisms. Values were obtained by comparing the results with the bacteria control. Data represent the mean of three independent experiments conducted in triplicate. * p < 0.05.
Figure 6
Figure 6
Virucidal effect of hypochlorous solution against Coronavirus 229E (A panel) and Adenovirus V (B panel) 1 × 10⁷ pfu/mL. HCoV-229E and Adenovirus V were incubated in the different surfaces and subjected to nebulization with a concentration of 300 ppm of HOCl. The nebulization time was set to 3 min and the exposure times 10 min. Data represent the percentage of viral reduction. Values were obtained by comparing the results with the virus control and represent the mean of 3 independent experiments. * p < 0.05.
Figure 7
Figure 7
Effects of HOCl nebulization on Epiderm and Epiairway tissues. Left panels (AD) Cytotoxicity evaluation by lactate dehydrogenase release in reconstructed human epidermis tissues (RHE) and Epiairway tissues maintenance media immediately after or after 24 h from the exposure to 300 ppm HOCl measured by an enzymatic assay. Right panels (EH) cytotoxicity evaluation by MTT assay in reconstructed human epidermis tissues (RHE) and Epiairway tissues immediately after or after 24 h from the exposure to 300 ppm HOCl. Data are presented as mean  ±  SEM of four different experiments. *** p < 0.0001.
Figure 8
Figure 8
Effects of HOCl nebulization on Epiderm and Epiairway barrier function. (A,B) TEER value of Epiderm tissue immediately after, and after 24 h of 300 ppm HOCl nebulization. (C,D) TEER value of Epiairway tissue immediately after, and after 24 h of 300 ppm HOCl nebulization. Data are expressed as mean ± SEM of four different experiments.
Figure 9
Figure 9
Epiderm (A) and Epiairway (B) tissue morphology evaluation by hematoxylin–eosin staining in control tissues and in tissues immediately after or 24 h after 300 ppm HOCL nebulization. Magnification 40×.
Figure 10
Figure 10
Upper panels: Epiderm morphology analyzed by TEM microscopy. (Left panels: AD): TEM images of Epiderm tissues exposed to air (T0h); basal layer with large intercellular spaces, compact inner layer cells; stratum corneum without discontinuity; (EH): TEM images of Epiderm tissues exposed to air (T24h); basal layer with large intercellular spaces, cells often vacuolized, loss of adhesion with the support; cells of the inner layers appear compact and stratum corneum compacted in many places, 5K magnification; (Right panels: AD): TEM images of Epiderm tissues exposed to 300 ppm HOCl (T0h); compact basal layer and also inner layers; thick horny layer; (EH): TEM images of Epiderm tissues exposed to 300 ppm HOCl (T24h); basal layer with large intercellular spaces, some vacuolized cells, detached from the support cells of the compact inner layers; stratum corneum with little areas of detachment, 5K magnification; Below panels: Epiairway morphology analyzed by TEM microscopy. (Left panels: AD): TEM images of Epiairway tissues exposed to air (T0h); cells appear functionally normal, nuclei, mitochondria and surface normal; there is large intercellular spacing and some cells with numerous electron-dense lysosomal granules; (EH): TEM images of Epiairway tissues exposed to air (T24h); basal cells with large intercellular spaces, detached from the support many in various necrotic steps, mitochondria dense with deposited material, superficial cells with less damaged but often vacuolized organelles rich in secretory granules, 5K magnification. (Right panels: JM): TEM images of Epiairway tissues exposed to 300 ppm HOCl (T0h); the basal cells show large intercellular spaces, partially detached from the support, mitochondria dense with deposited material, superficial cells with normal ultrastructure (NR): TEM images of Epiairway tissues exposed to 300 ppm HOCl (T24h); basal cells with large intercellular spaces, partially detached from the support, mitochondria dense with deposited material, superficial cells with less damaged but often vacuolized organelles rich in secretory granules, 5K magnification.

References

    1. Jain P. The COVID-19 Pandemic and Positive Psychology: The Role of News and Trust in News on Mental Health and Well-Being. J. Health Commun. 2021;26:317–327. doi: 10.1080/10810730.2021.1946219. - DOI - PubMed
    1. Sabin N.S., Calliope A.S., Simpson S.V., Arima H., Ito H., Nishimura T., Yamamoto T. Implications of Human Activities for (Re) Emerging Infectious Diseases, Including COVID-19. J. Physiol. Anthropol. 2020;39:29. doi: 10.1186/s40101-020-00239-5. - DOI - PMC - PubMed
    1. Cloeckaert A., Kuchler K. Grand Challenges in Infectious Diseases: Are We Prepared for Worst-Case Scenarios? Front. Microbiol. 2020;11:613383. doi: 10.3389/fmicb.2020.613383. - DOI - PMC - PubMed
    1. Zimlichman E., Henderson D., Tamir O., Franz C., Song P., Yamin C.K., Keohane C., Denham C.R., Bates D.W. Health Care–Associated Infections: A Meta-Analysis of Costs and Financial Impact on the US Health Care System. JAMA Intern. Med. 2013;173:2039–2046. doi: 10.1001/jamainternmed.2013.9763. - DOI - PubMed
    1. Enyoh C.E., Verla A.W., Qingyue W., Yadav D.K., Chowdhury M.A.H., Isiuku B.O., Chowdhury T., Ibe F.C., Verla E.N., Maduka T.O. Indirect Exposure to Novel Coronavirus (SARS-CoV-2): An Overview of Current Knowledge. J. Teknol. Lab. 2020;9:67–77. doi: 10.29238/teknolabjournal.v9i1.227. - DOI

Publication types