

Impacts of Stressors on Riparian Health Indicators in the Upper and Lower Indus River Basins in Pakistan
- PMID: 36293824
- PMCID: PMC9603529
- DOI: 10.3390/ijerph192013239
Impacts of Stressors on Riparian Health Indicators in the Upper and Lower Indus River Basins in Pakistan
Abstract
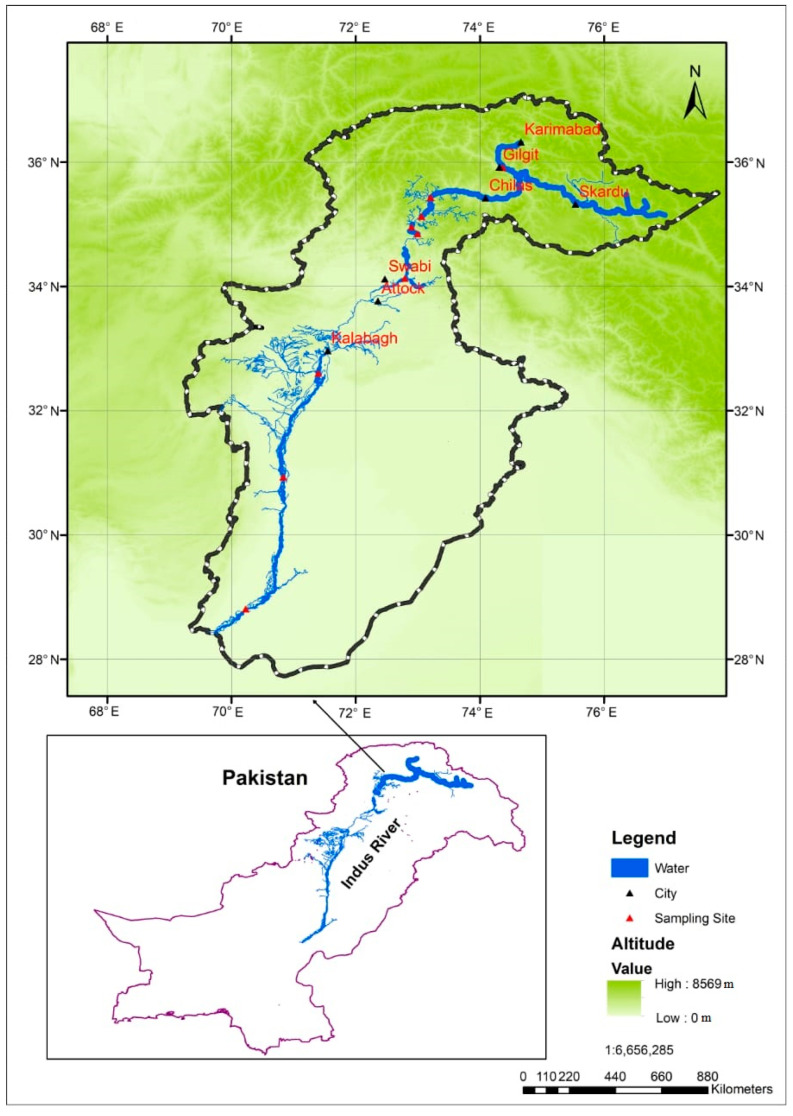
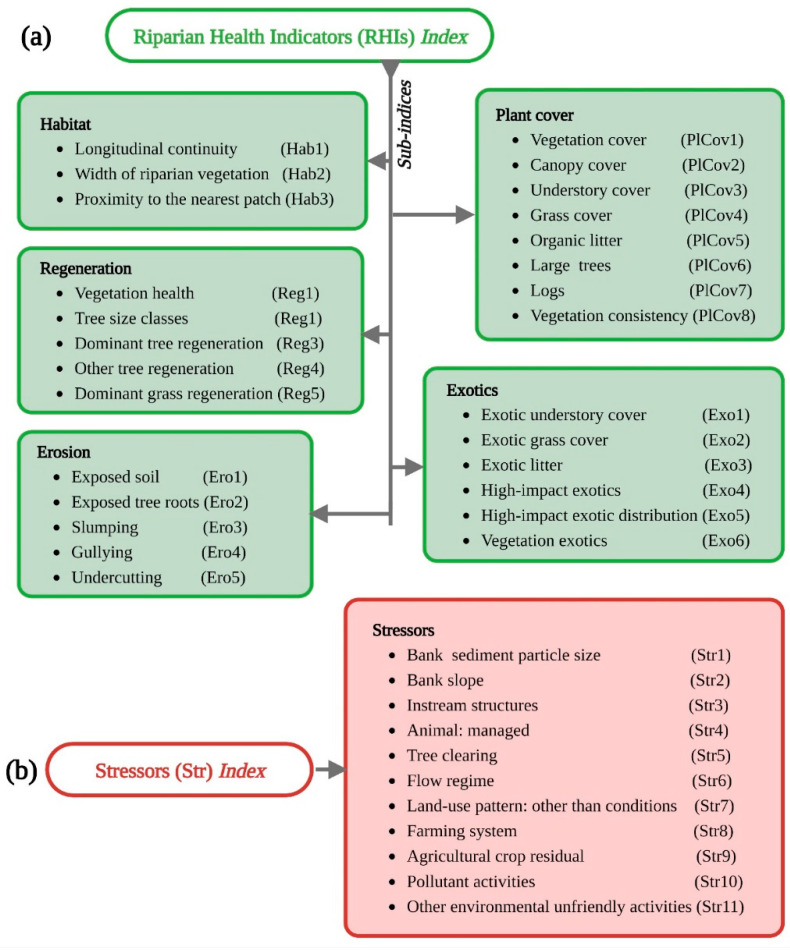
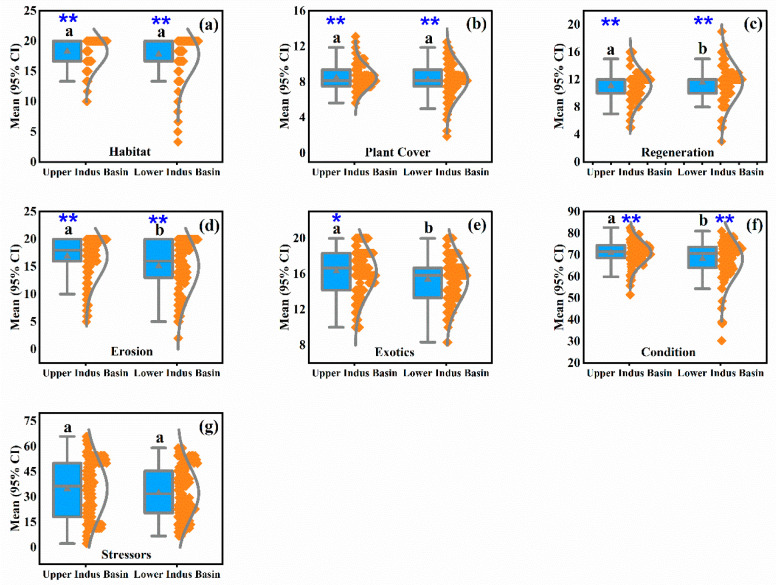
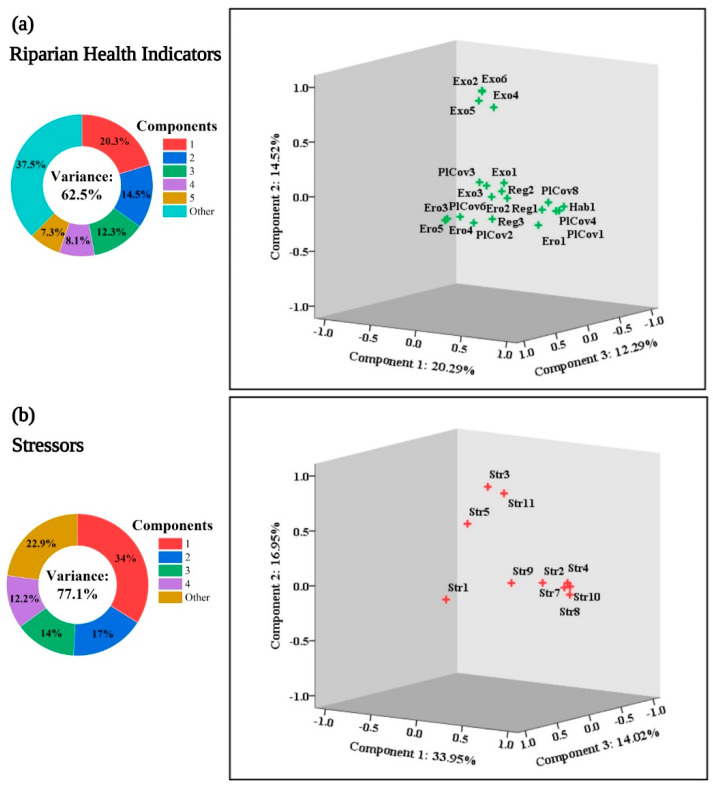
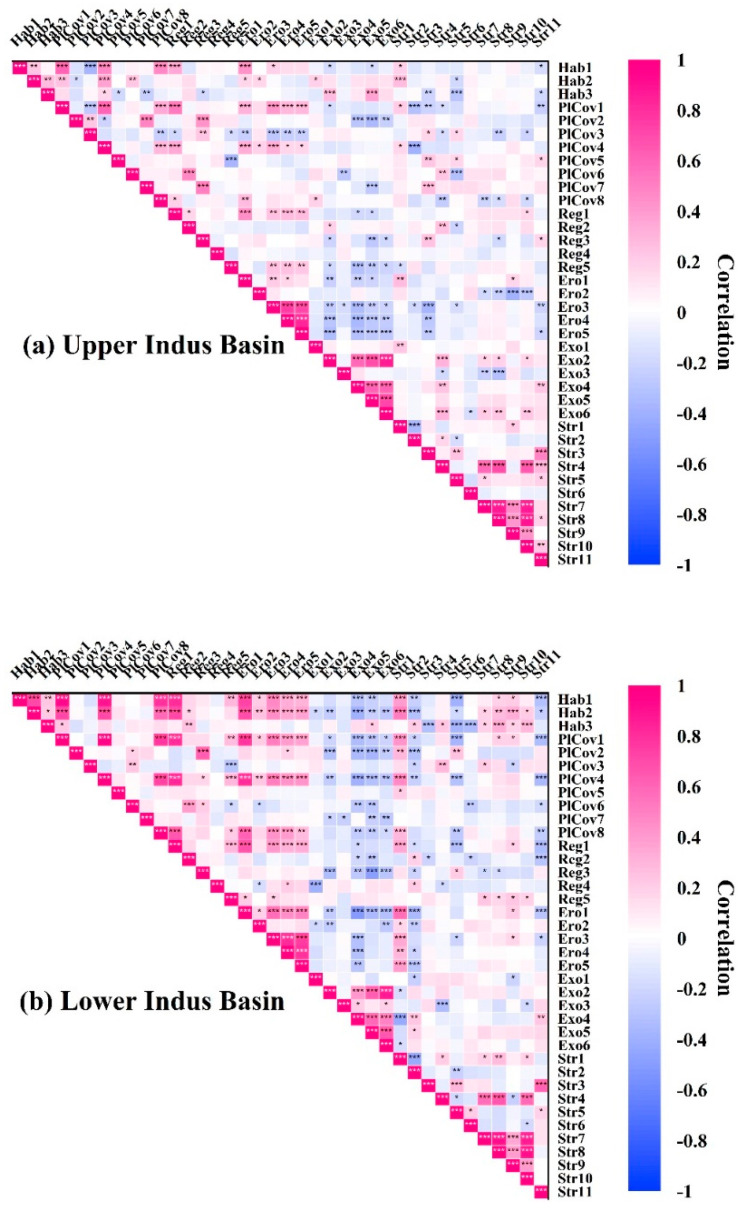
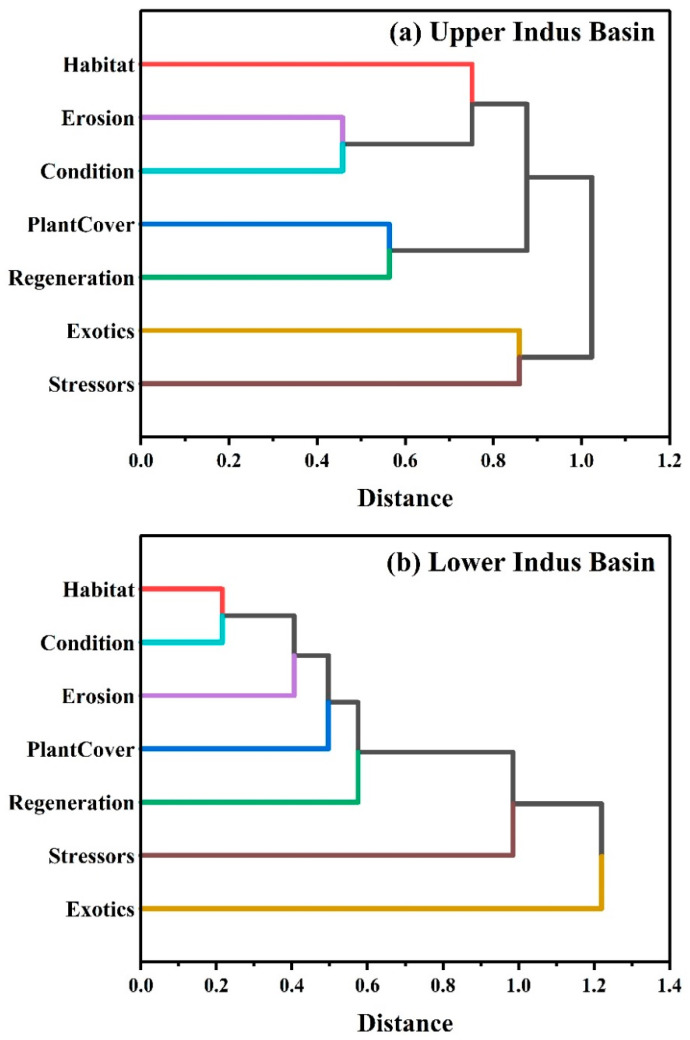
Riparian zones along rivers and streams provide ecosystem services that may change over time as disturbances increase and deteriorate these buffer zones globally. The effect of stressors on ecosystem services along the rivers in underdeveloped countries is unclear, which impacts the environment directly in the form of riparian health indicators (RHIs). This study fills this gap and measures the impact of stressors on RHIs (parameters of habitat, plant cover, regeneration, exotics, and erosion) in the Indus River basin (IRB) in Pakistan. Data on 11 stressors and 27 RHIs were collected using a field-based approach in 269 transects in the upper and lower Indus basins (UIB and LIB) in 2020 and analyzed using multivariate statistical methods. The Kruskal-Wallis tests (p < 0.05) indicated that RHIs varied significantly under the influence of stressors in the UIB and LIB. However, their highest mean values were found in the UIB. Principal component analysis revealed the key RHIs and stressors, which explained 62.50% and 77.10% of the variance, respectively. The Pearson correlation showed that stressors had greater impacts on RHIs in LIB (with r ranging from -0.42 to 0.56). Our results also showed that stressors affected RHI indices with r ranging from -0.39 to 0.50 (on habitat), -0.36 to 0.46 (on plant cover), -0.34 to 0.35 (on regeneration), -0.34 to 0.56 (on erosion), and -0.42 to 0.23 (on exotics). Furthermore, it was confirmed by the agglomerative hierarchical cluster that indices and sub-indices of RHIs and stressors differ across the UIB and LIB. These findings may serve as guidance for managers of large rivers and ecosystem service providers to minimize the environmental impact of stressors in terms of RHIs.
Keywords: Indus River; Terbela Dam Reservoir; ecosystem function; environmental indicators; pressure indicators; rapid appraisal; riparian health assessment.
Conflict of interest statement
The authors declare no conflict of interest.
Figures
Similar articles
-
Spatial variation, source identification, and quality assessment of surface water geochemical composition in the Indus River Basin, Pakistan.Environ Sci Pollut Res Int. 2018 May;25(13):12749-12763. doi: 10.1007/s11356-018-1519-z. Epub 2018 Feb 22. Environ Sci Pollut Res Int. 2018. PMID: 29470753
-
Impacts of riparian width and stream channel width on ecological networks in main waterways and tributaries.Sci Total Environ. 2021 Oct 20;792:148457. doi: 10.1016/j.scitotenv.2021.148457. Epub 2021 Jun 17. Sci Total Environ. 2021. PMID: 34153764
-
Assessing riparian zone changes under the influence of stress factors in higher-order streams and tributaries: Implications for the management of massive dams and reservoirs.Sci Total Environ. 2021 Jul 1;776:146011. doi: 10.1016/j.scitotenv.2021.146011. Epub 2021 Feb 23. Sci Total Environ. 2021. PMID: 33647660
-
Dam reservoir backwater as a field-scale laboratory of human-induced changes in river biogeomorphology: A review focused on gravel-bed rivers.Sci Total Environ. 2019 Feb 15;651(Pt 2):2899-2912. doi: 10.1016/j.scitotenv.2018.10.138. Epub 2018 Oct 15. Sci Total Environ. 2019. PMID: 30463142 Review.
-
Evaluating riparian solutions to multiple stressor problems in river ecosystems - A conceptual study.Water Res. 2018 Aug 1;139:381-394. doi: 10.1016/j.watres.2018.04.014. Epub 2018 Apr 8. Water Res. 2018. PMID: 29673937 Review.
Cited by
-
Plant community assembly is jointly shaped by environmental and dispersal filtering along elevation gradients in a semiarid area, China.Front Plant Sci. 2022 Nov 25;13:1041742. doi: 10.3389/fpls.2022.1041742. eCollection 2022. Front Plant Sci. 2022. PMID: 36507391 Free PMC article.
References
-
- Arif M., Jie Z., Tahir M., Xin H., Changxiao L. The impact of stress factors on riparian and drawdown zones degradation around dams and reservoirs. Land Degrad. Dev. 2022;33:2127–2141. doi: 10.1002/ldr.4310. - DOI
-
- Belete M., Deng J., Abubakar G.A., Teshome M., Wang K., Woldetsadik M., Zhu E., Comber A., Gudo A. Partitioning the impacts of land use/land cover change and climate variability on water supply over the source region of the Blue Nile Basin. Land Degrad. Dev. 2020;31:2168–2184. doi: 10.1002/ldr.3589. - DOI
-
- Bylak A., Kukuła K., Ortyl B., Hałoń E., Demczyk A., Janora-Hołyszko K., Ziobro J. Small stream catchments in a developing city context: The importance of land cover changes on the ecological status of streams and the possibilities for providing ecosystem services. Sci. Total Environ. 2022;815:151974. doi: 10.1016/j.scitotenv.2021.151974. - DOI - PubMed
-
- de Mello K., Valente R.A., Randhir T.O., Alves dos Santos A.C., Vettorazzi C.A. Effects of land use and land cover on water quality of low-order streams in Southeastern Brazil: Watershed versus riparian zone. Catena. 2018;167:130–138. doi: 10.1016/j.catena.2018.04.027. - DOI
Publication types
MeSH terms
Grants and funding
LinkOut - more resources
Full Text Sources
Miscellaneous
