. 2022 Oct 21;11(20):6218.
doi: 10.3390/jcm11206218.

Chondral/Desmal Osteogenesis in 3D Spheroids Sensitized by Psychostimulants

Affiliations

Chondral/Desmal Osteogenesis in 3D Spheroids Sensitized by Psychostimulants

Nele Wagener et al. J Clin Med. .

Abstract

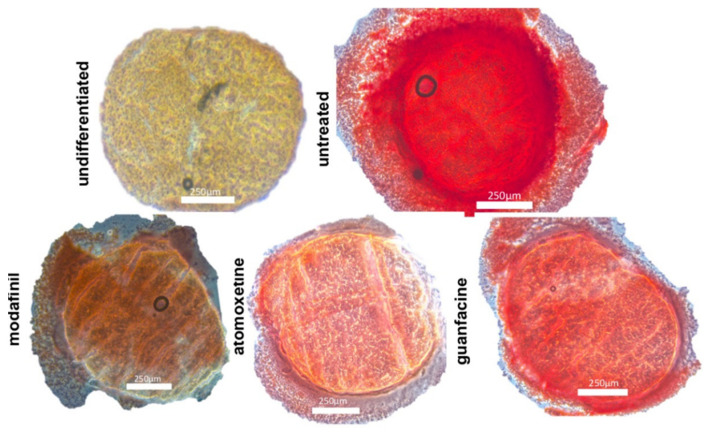
Attention deficit hyperactivity disorder (ADHD) affects 6.4 million children in the United States of America. Children and adolescents, the main consumers of ADHD medication, are in the bone growth phase, which extends over a period of up to two decades. Thus, impaired proliferation and maturation of chondrocytes and osteoblasts can result in impaired bone formation. The aim of this study is to investigate, for the first time, the effects of the ADHD-medication modafinil, atomoxetine and guanfacine on bone growth and repair in vitro. Using two-dimensional and three-dimensional cell models, we investigated the chondrogenic/osteogenic differentiation, proliferation and viability of human mesenchymal progenitor cells. Real-time cell proliferation was measured by xCELLigence. Live/dead staining and size measurement of hMSC- and MG63 monolayer and spheroids were performed after administration of therapeutic plasma concentrations of modafinil, atomoxetine and guanfacine. Chondrogenic differentiation was quantified by RTqPCR. The chondrogenic and osteogenic differentiation was evaluated by histological cryo-sections. Modafinil, atomoxetine and guanfacine reduced chondrogenic and osteogenic differentiation terms of transcript expression and at the histological level. Cell viability of the MG63- and hMSC monolayer was not impeded by ADHD-medication. Our in vitro results indicate that modafinil, atomoxetine and guanfacine may impair chondrogenic and osteogenic differentiation in a 3D model reflecting the in vivo physiologic condition.

Keywords: bone defect; cell spheroids ADHD; cell viability; hMSCs; osteogenic/chondrogenic differentiation.


Conflict of interest statement

The authors declare that they have no conflict of interest.

Figures

Figure 1
Figure 1
XCELLigence analysis of real-time cell proliferation of untreated MG63 (A), untreated hMSC (B) and after the administration of modafinil (11.2 μg/mL), atomoxetine (0.9 µg/mL) and guanfacine (17.7 ng/mL) to hMSC and MG63 for 100 h. Shown are means of normalized cell index ± SD of three independent experiments with six biological replicates.
Figure 2
Figure 2
Effect of starting cell number after administration of untreated modafinil (11.2 μg/mL), atomoxetine (0.9 µg/mL) and guanfacine (17.7 ng/mL) on spheroid size and morphology of MG63 (5000 cells) (A,B) and MG63 (8000 cells) (C,D). Spheroids were cultured for 21 days. Phase- contrast images of spheroids were taken at day 7, 14 and 21. Shown are means of spheroid size ± SD of three independent experiments with six biological replicates. Densitometric quantification of spheroid size was calculated by ImageJ software. Significance in difference between the groups was determined by ANOVA followed by Tukey’s post hoc test. Scale bar 250 µm.
Figure 2
Figure 2
Effect of starting cell number after administration of untreated modafinil (11.2 μg/mL), atomoxetine (0.9 µg/mL) and guanfacine (17.7 ng/mL) on spheroid size and morphology of MG63 (5000 cells) (A,B) and MG63 (8000 cells) (C,D). Spheroids were cultured for 21 days. Phase- contrast images of spheroids were taken at day 7, 14 and 21. Shown are means of spheroid size ± SD of three independent experiments with six biological replicates. Densitometric quantification of spheroid size was calculated by ImageJ software. Significance in difference between the groups was determined by ANOVA followed by Tukey’s post hoc test. Scale bar 250 µm.
Figure 3
Figure 3
The effect of starting cell number under administration of untreated modafinil. (11.2 μg/mL), atomoxetine (0.9 µg/mL) and guanfacine (17.7 ng/mL) on spheroid size and morphology of hMSC (5000 cells) (A,B) and hMSC (8000 cells) (C,D). Spheroids were cultured for 21 days. Phase-contrast images of spheroids were taken at day 7, 14 and 21. Shown are means of spheroid size ± SD of three independent experiments with six biological replicates. Densitometric quantification of spheroid size was calculated by ImageJ software. Significance in difference between the groups was determined by ANOVA followed by Tukey’s post hoc test. Scale bar 250 µm. * corresponds to a value of p < 0.05.
Figure 3
Figure 3
The effect of starting cell number under administration of untreated modafinil. (11.2 μg/mL), atomoxetine (0.9 µg/mL) and guanfacine (17.7 ng/mL) on spheroid size and morphology of hMSC (5000 cells) (A,B) and hMSC (8000 cells) (C,D). Spheroids were cultured for 21 days. Phase-contrast images of spheroids were taken at day 7, 14 and 21. Shown are means of spheroid size ± SD of three independent experiments with six biological replicates. Densitometric quantification of spheroid size was calculated by ImageJ software. Significance in difference between the groups was determined by ANOVA followed by Tukey’s post hoc test. Scale bar 250 µm. * corresponds to a value of p < 0.05.
Figure 4
Figure 4
Chondrogenic differentiation of mesenchymal stem cell spheroids for 21 days. Alcian blue nuclear fast red stained images of untreated, modafinil (11.2 μg/mL)-, atomoxetine- (0.9 µg/mL) and guanfacine- (17,675 ng/mL) treated chondrogenic spheroids. Scale bar 250 µm.
Figure 5
Figure 5
Expression of SOX9, Aggrecan and COL2A1 transcripts was determined in untreated, modafinil- (11.2 μg/mL), atomoxetine- (0.9 µg/mL) and guanfacine- (17.7 ng/mL) treated chondrogenic spheroids. Shown are means of normalized expression ± SD of three independent experiments with six biological replicates. The GAPDH transcript level was used to normalize the expression of the target genes. Significance in difference between the groups was determined by ANOVA followed by Tukey’s post hoc test. * corresponds to a value of p < 0.05. ** corresponds to a value of p < 0.01.
Figure 6
Figure 6
Osteogenic differentiation of mesenchymal stem cell spheroids for 28 days. Alizarin red stained images of untreated, modafinil (11.2 μg/mL)-, atomoxetine (0.9 µg/mL)- and guanfacine- (17.7 ng/mL) treated osteogenic spheroids. Three independent experiments with six biological replicates were carried out. Alizarin red (A) stained images of untreated, modafinil- (11.2 μg/mL), atomoxetine- (0.9 µg/mL) and guanfacine (17.7 ng/mL)- treated MG63 spheroids. Three independent experiments with six biological replicates were carried out. Scale bar 250 µm.
Figure 7
Figure 7
Alizarin red stained images of untreated, modafinil (11.2 μg/mL)-, atomoxetine- (0.9 µg/mL) and guanfacine- (17.7 ng/mL) treated MG63 spheroids. Three independent experiments with six biological replicates were carried out. Scale bar 250 µm.
Figure 8
Figure 8
Cell viability assay of MG63-monolayer, using a live/dead staining with FDA. (green, live cells) and PI (red, dead cells). Images represent 7, 14 and 21-day-old monolayer MG63 of untreated, modafinil- (11.2 μg/mL), atomoxetine- (0.9 µg/mL) and guanfacine- (17.7 ng/mL) treated cells. Shown are three independent experiments with six biological replicates. Densitometric quantification of viable (green) and nonviable (red) cells was calculated by ImageJ software. Significance in difference between the groups was determined by ANOVA followed by Tukey’s post hoc test. Scale bar 150 µm.
Figure 9
Figure 9
Cell viability assay of hMSC-monolayer, using a live/dead staining with FDA. (green, live cells) and PI (red, dead cells). Images represent 7, 14 and 21-day-old monolayer hMSC of untreated, modafinil- (11.2 μg/mL), atomoxetine- (0.9 µg/mL) and guanfacine- (17.7 ng/mL) treated cells. Shown are three independent experiments with six biological replicates. Densitometric quantification of viable (green) and nonviable (red) cells was calculated by ImageJ software. Significance in difference between the groups was determined by ANOVA followed by Tukey’s post hoc test. Scale bar 150 µm.

Similar articles

Cited by

References

    1. Wilens T.E., Spencer T.J. Understanding attention-deficit/hyperactivity disorder from childhood to adulthood. Postgrad Med. 2010;122:97–109. doi: 10.3810/pgm.2010.09.2206. - DOI - PMC - PubMed
    1. Xia C., Ge Q., Fang L., Yu H., Zou Z., Zhang P., Lv S., Tong P., Xiao L., Chen D., et al. TGF-β/Smad2 signalling regulates enchondral bone formation of Gli1+ periosteal cells during fracture healing. Cell Prolif. 2020;53:12904. doi: 10.1111/cpr.12904. - DOI - PMC - PubMed
    1. Science Direct: Endochondral Ossification. [(accessed on 16 June 2022)]. Available online: https://www.sciencedirect.com/topics/veterinary-science-and-veterinary-m....
    1. Wu Z., Korntner S.H., Mullen A.M., Zeugolis D.I. Collagen type II: From biosynthesis to advanced biomaterials for cartilage engineering. Biomater. Biosyst. 2021;4:100030. doi: 10.1016/j.bbiosy.2021.100030. - DOI - PMC - PubMed
    1. Hallett S.A., Ono W., Ono N. Growth Plate Chondrocytes: Skeletal Development, Growth and Beyond. Int. J. Mol. Sci. 2019;20:6009. doi: 10.3390/ijms20236009. - DOI - PMC - PubMed

LinkOut - more resources