. 2022 Sep 28;8(10):1028.
doi: 10.3390/jof8101028.

Overexpression of the White Opaque Switching Master Regulator Wor1 Alters Lipid Metabolism and Mitochondrial Function in Candida albicans

Affiliations

Overexpression of the White Opaque Switching Master Regulator Wor1 Alters Lipid Metabolism and Mitochondrial Function in Candida albicans

Susana Hidalgo-Vico et al. J Fungi (Basel). .

Abstract

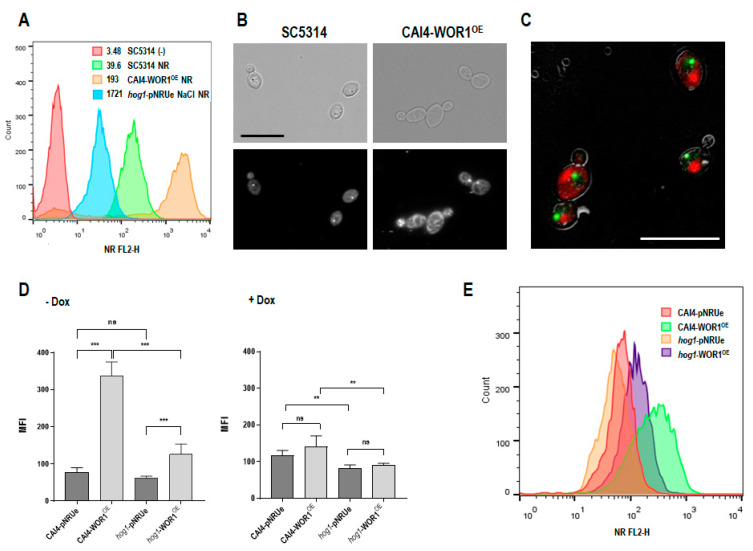
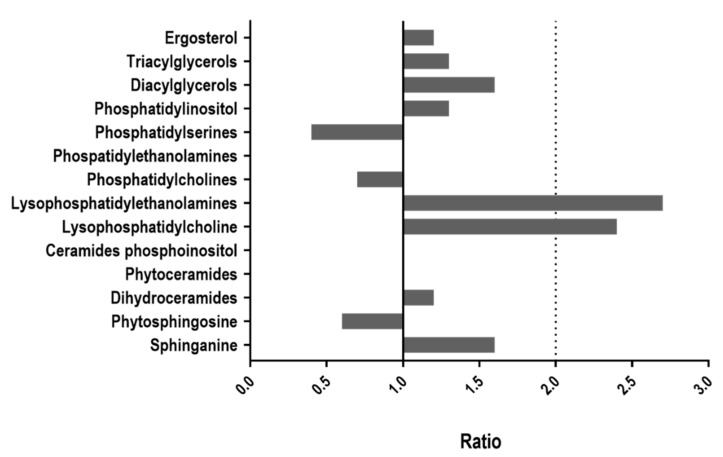
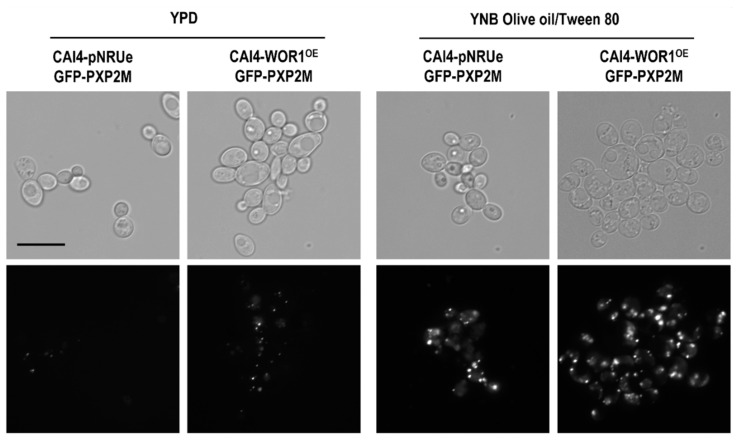
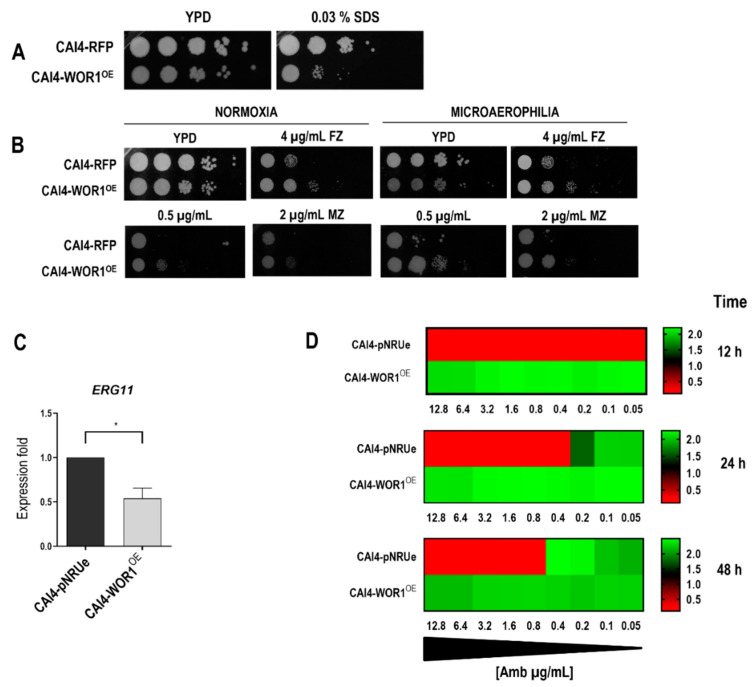
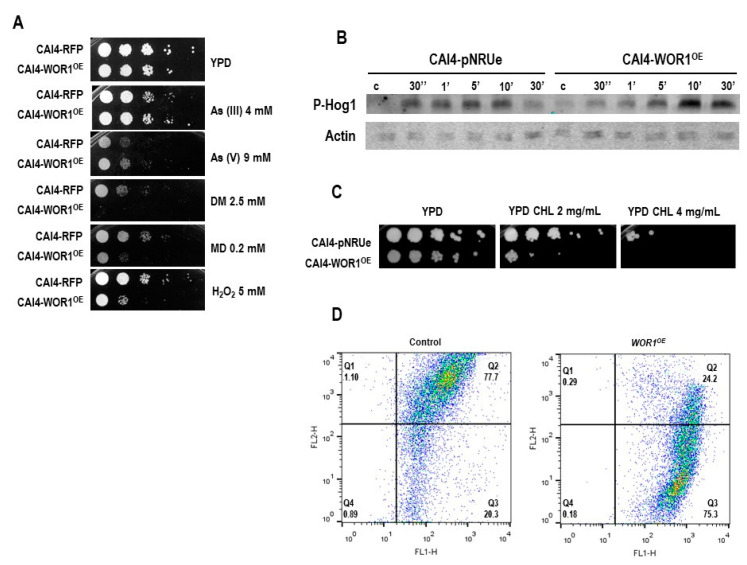
Candida albicans is a commensal yeast that inhabits the gastrointestinal tract of humans; increased colonization of this yeast in this niche has implicated the master regulator of the white-opaque transition, Wor1, by mechanisms not completely understood. We have addressed the role that this transcription factor has on commensalism by the characterization of strains overexpressing this gene. We show that WOR1 overexpression causes an alteration of the total lipid content of the fungal cell and significantly alters the composition of structural and reserve molecular species lipids as determined by lipidomic analysis. These cells are hypersensitive to membrane-disturbing agents such as SDS, have increased tolerance to azoles, an augmented number of peroxisomes, and increased phospholipase activity. WOR1 overexpression also decreases mitochondrial activity and results in altered susceptibility to certain oxidants. All together, these changes reflect drastic alterations in the cellular physiology that facilitate adaptation to the gastrointestinal tract environment.

Keywords: Candida albicans; Wor1; commensalism; gut; lipid; mitochondrial activity; reactive oxygen species.


Conflict of interest statement

The authors declare no conflict of interest. The funders had no role in the design of the study; in the collection, analyses, or interpretation of data; in the writing of the manuscript, or in the decision to publish the results.

Figures

Figure 1
Figure 1
Nile red staining. (A) Cells in stationary phase of growth were collected and stained with 5 µg/mL of Nile red (NR). The hog1 mutant with the empty vector (hog1-pNRUe) grown on YPD NaCl 1 M was used as a positive control. Stained cells were analyzed by performing flow cytometry as described in the Material and Methods (λex of 488 nm) and the mean fluorescence intensity (MFI) of a representative experiment is shown as a histogram. The inner legend lists the MFI for each strain analyzed; an unstained control is included (SC5314 (-), red). (B) Nile red stained cells of the indicated strains under fluorescence microscopy are shown. The scale bar represents 10 µm cell size. (C) Overnight growing CAI4-WOR1OE cells were stained with Nile red (red signal) and DAPI (green signal) for 10 min. The image represents an overlay of the bright field and fluorescent signals. (D) Cells were grown in YPD supplemented with or without doxycycline for 24 h and stained with Nile red. Graphs represent the MFI ± SD of five experiments ns: not significant, ** p < 0.01, *** p < 0.001. (E) A representative histogram of samples in D grown in the absence of doxycycline is shown.
Figure 2
Figure 2
Lipid content quantification by LC-HRMS-TOF. Stationary phase cells were mechanically disrupted in MeOH + BHT and the dry residue was extracted for further analysis in the chromatograph. The total lipid content of each type was calculated with the sum of all the molecular species found in pmol eq./unit of O.D. and expressed in a ratio CAI4-WOR1OE/CAI4-pNRUe.
Figure 3
Figure 3
Fluorescent labeling of peroxisomes. CAI4-pNRUe and CAI4-WOR1OE strains producing the GFP-Pxp2M fusion protein were grown 72 h at 37 °C on YPD or YNB supplemented with 0.12% olive oil/0.2% Tween 80 and microscopy images were taken. The scale bar corresponds to a 10 µm size.
Figure 4
Figure 4
Effect of WOR1 overexpression on membrane disturbing agents’ sensitivity. Suspensions from the indicated strains grown overnight in YPD at 37 °C were prepared at 2 × 10⁷ cells/mL and five microliters from tenfold dilutions were spotted on YPD plates supplemented with SDS (A), fluconazole (FZ), or miconazole (MZ) at the indicated concentrations (B). Plates were incubated in normoxia for 24 h or microaerophilia for 48 h before being scanned. (C) ERG11 mRNA transcript expression levels in exponentially growing cells normalized to ACT1 expression. Fold expression using as a reference the value of the strain, CAI4-pNRUe is shown as the mean ± SD of three independent experiments. * p < 0.05. (D) Heat map depicts the median of absorbances at the indicated times of CAI4-WOR1OE and control CAI4-pNRUe cells grown in YPD media supplemented with amphotericin B (AmB) at different concentrations (µg/mL).
Figure 5
Figure 5
Role of WOR1 overexpression in the oxidative stress response and mitochondrial function. (A) Susceptibility to arsenic-derived compounds and oxidants. 105 stationary cells and tenfold dilutions from either RFP and WOR1OE strains were spotted onto YPD plates supplemented with As (III), As (IV), diamide (DM), menadione (MD) or H2O2 at the indicated concentrations. Plates were incubated at 37 °C for 24 h in normoxia. (B) Exponentially growing cells were exposed to 3 mM H2O2 and samples were collected before and at 30 s and 1, 5, 10, and 30 min after exposure. Hog1 phosphorylation was detected by western blot using the anti-phospho-Hog1 antibody, and actin was used as a loading control. (C) Growth in presence of chloramphenicol. Cells were spotted onto YPD plates supplemented with 2 or 4 mg/mL of chloramphenicol and incubated at 37 °C for 2 days. (D) Dot plot analysis of the mitochondrial membrane potential determined by JC-1 dye. 106 cells from CAI4-pNRUe and CAI4-WOR1OE strains grown in YPG were stained with 1.5 µM JC-1 for 30 min at 37 °C and in the absence of light and analyzed by flow cytometry at an excitation λ of 488 nm. FL2-H and FL1-H represent red and green fluorescence, respectively.

Similar articles

References

    1. Alonso-Monge R., Gresnigt M.S., Roman E., Hube B., Pla J. Candida albicans colonization of the gastrointestinal tract: A double-edged sword. PLoS Pathog. 2021;17:e1009710. doi: 10.1371/journal.ppat.1009710. - DOI - PMC - PubMed
    1. Romo J.A., Kumamoto C.A. On Commensalism of Candida. J. Fungi. 2020;6:16. doi: 10.3390/jof6010016. - DOI - PMC - PubMed
    1. Markey L., Shaban L., Green E.R., Lemon K.P., Mecsas J., Kumamoto C.A. Pre-colonization with the commensal fungus Candida albicans reduces murine susceptibility to Clostridium difficile infection. Gut Microbes. 2018;9:497–509. doi: 10.1080/19490976.2018.1465158. - DOI - PMC - PubMed
    1. Youssef E.G., Zhang L., Alkhazraji S., Gebremariam T., Singh S., Yount N.Y., Yeaman M.R., Uppuluri P., Ibrahim A.S. Monoclonal IgM Antibodies Targeting Candida albicans Hyr1 Provide Cross-Kingdom Protection against Gram-Negative Bacteria. Front. Immunol. 2020;11:76. doi: 10.3389/fimmu.2020.00076. - DOI - PMC - PubMed
    1. Pappas P.G., Lionakis M.S., Arendrup M.C., Ostrosky-Zeichner L., Kullberg B.J. Invasive candidiasis. Nat. Rev. Dis. Prim. 2018;4:18026. doi: 10.1038/nrdp.2018.26. - DOI - PubMed

LinkOut - more resources