. 2022 Sep 27;58(10):1352.
doi: 10.3390/medicina58101352.

Silent Pauses and Speech Indices as Biomarkers for Primary Progressive Aphasia

Affiliations

Silent Pauses and Speech Indices as Biomarkers for Primary Progressive Aphasia

Constantin Potagas et al. Medicina (Kaunas). .

Abstract

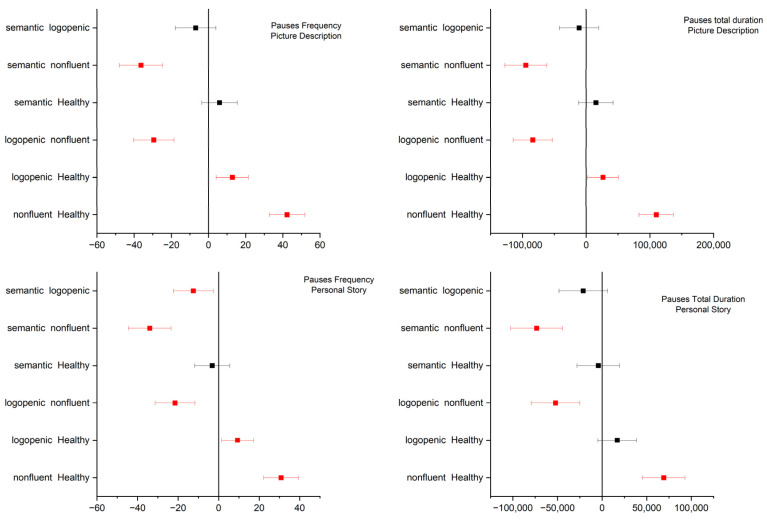
Background and Objectives: Recent studies highlight the importance of investigating biomarkers for diagnosing and classifying patients with primary progressive aphasia (PPA). Even though there is ongoing research on pathophysiological indices in this field, the use of behavioral variables, and especially speech-derived factors, has drawn little attention in the relevant literature. The present study aims to investigate the possible utility of speech-derived indices, particularly silent pauses, as biomarkers for primary progressive aphasia (PPA). Materials and Methods: We recruited 22 PPA patients and 17 healthy controls, from whom we obtained speech samples based on two elicitation tasks, i.e., cookie theft picture description (CTP) and the patients' personal narration of the disease onset and course. Results: Four main indices were derived from these speech samples: speech rate, articulation rate, pause frequency, and pause duration. In order to investigate whether these indices could be used to discriminate between the four groups of participants (healthy individuals and the three patient subgroups corresponding to the three variants of PPA), we conducted three sets of analyses: a series of ANOVAs, two principal component analyses (PCAs), and two hierarchical cluster analyses (HCAs). The ANOVAs revealed significant differences between the four subgroups for all four variables, with the CTP results being more robust. The subsequent PCAs and HCAs were in accordance with the initial statistical comparisons, revealing that the speech-derived indices for CTP provided a clearer classification and were especially useful for distinguishing the non-fluent variant from healthy participants as well as from the two other PPA taxonomic categories. Conclusions: In sum, we argue that speech-derived indices, and especially silent pauses, could be used as complementary biomarkers to efficiently discriminate between PPA and healthy speakers, as well as between the three variants of the disease.

Keywords: articulation rate; connected speech; primary progressive aphasia; silent pauses; speech rate.


Conflict of interest statement

The authors declare no conflict of interest.

Figures

Figure 1
Figure 1
Box plots of pause total duration and frequency data for each type of diagnosis. First row: picture description task. Second row: personal story narration. Each box has a range of 25–75, the whiskers indicate the range of the outliers, the colored line inside each box is the median, and the short dashed lines are the mean.
Figure 2
Figure 2
Box plots of speech rate and articulation data for each type of diagnosis. First row: picture description task. Second row: personal story narration. Each box has a range of 25–75, the whiskers indicate the range of the outliers, the colored line inside each box is the median, and the short dashed lines are the mean.
Figure 3
Figure 3
Tukey’s significance test of the one-way ANOVA results for the pause total duration and frequency data of each type of diagnosis. First row: picture description task. Second row: personal story narration. Significance level: 0.05.
Figure 4
Figure 4
Tukey’s significance test of the one-way ANOVA results for the speech and articulation rate data of each type of diagnosis. First row: picture description task. Second row: personal story narration. Significance level: 0.05.
Figure 5
Figure 5
Scatter plots with convex hull ellipse depicting pause attributes versus speech attributes for the picture description task.
Figure 6
Figure 6
Scatter plots with convex hull ellipse depicting pause attributes versus speech attributes for the personal story task.
Figure 7
Figure 7
Re-classification of data for the picture description task. First node is the initial diagnosis.
Figure 8
Figure 8
Re-classification of data for the personal story narration task. First node is the initial diagnosis.

Similar articles

Cited by

References

    1. Mesulam M.M. Primary progressive aphasia. Ann. Neurol. 2001;49:425–432. doi: 10.1002/ana.91. - DOI - PubMed
    1. Hodges J.R., Davies R.R., Xuereb J.H., Casey B., Broe M., Bak T.H., Kril J.J., Halliday G.M. Clinicopathological correlates in frontotemporal dementia. Ann. Neurol. 2004;56:399–406. doi: 10.1002/ana.20203. - DOI - PubMed
    1. Gorno-Tempini M.L., Hillis A.E., Weintraub S., Kertesz A., Mendez M., Cappa S.F., Ogar J.M., Rohrer J.D., Black S., Boeve B.F., et al. Classification of primary progressive aphasia and its variants. Neurology. 2011;76:1006–1014. doi: 10.1212/WNL.0b013e31821103e6. - DOI - PMC - PubMed
    1. Mesulam M.M., Weintraub S., Rogalski E.J., Wieneke C., Geula C., Bigio E.H. Asymmetry and heterogeneity of Alzheimer’s and frontotemporal pathology in primary progressive aphasia. Brain. 2014;137:1176–1192. doi: 10.1093/brain/awu024. - DOI - PMC - PubMed
    1. Mesulam M.M., Rogalski E.J., Wieneke C., Hurley R.S., Geula C., Bigio E.H., Thompson C.K., Weintraub S. Primary progressive aphasia and the evolving neurology of the language network. Nat. Rev. Neurol. 2014;10:554–569. doi: 10.1038/nrneurol.2014.159. - DOI - PMC - PubMed

LinkOut - more resources