

Comparison of Hepatic Metabolite Profiles between Infant and Adult Male Mice Using 1H-NMR-Based Untargeted Metabolomics
- PMID: 36295812
- PMCID: PMC9611911
- DOI: 10.3390/metabo12100910
Comparison of Hepatic Metabolite Profiles between Infant and Adult Male Mice Using 1H-NMR-Based Untargeted Metabolomics
Abstract
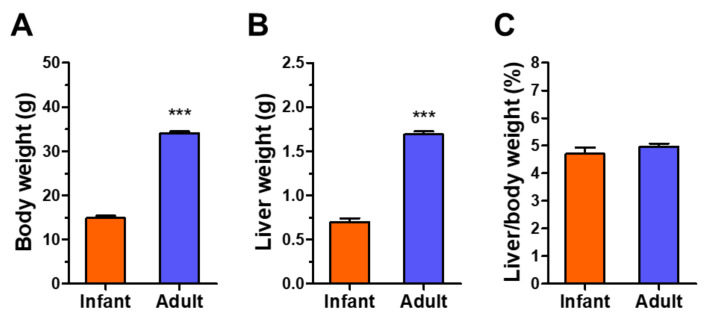
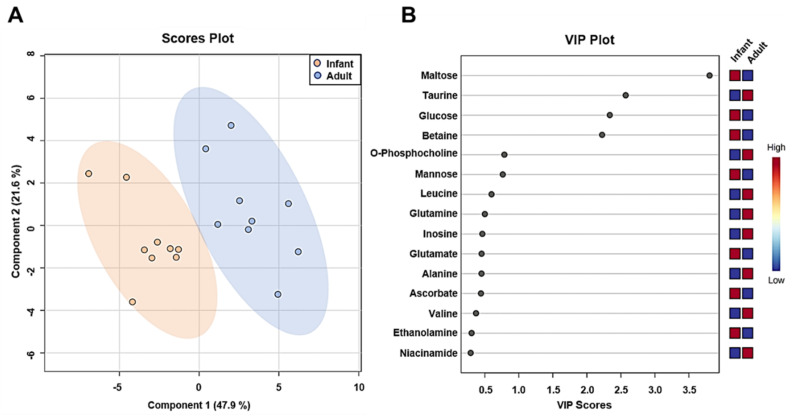
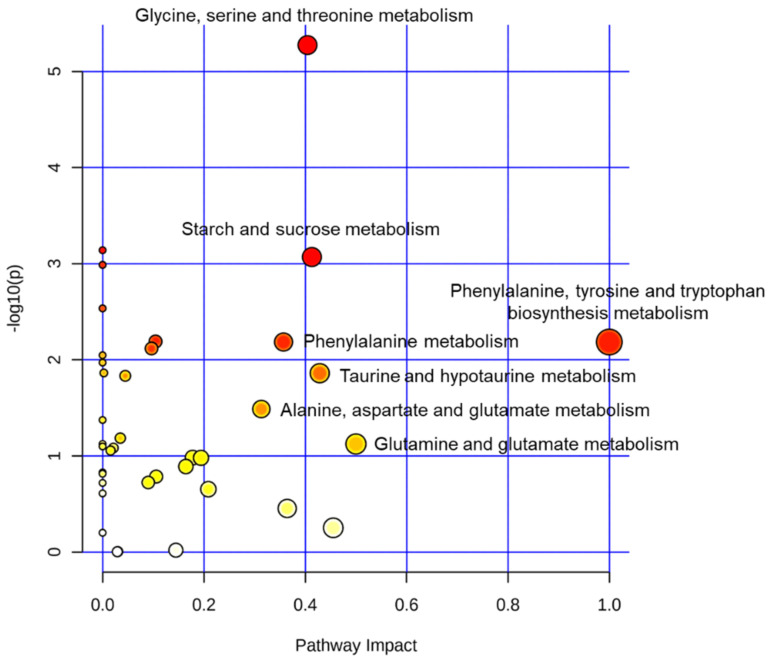
Although age-related characteristics of hepatic metabolism are reported, those in infants are not fully understood. In the present study, we performed untargeted metabolomic profiling of the livers of infant (3-week-old) and adult (9-week-old) male ICR mice using 1H-NMR spectroscopy and compared 35 abundant hepatic metabolite concentrations between the two groups. The liver/body weight ratio did not differ between the two groups; however, serum glucose, blood urea nitrogen, total cholesterol, and triglyceride concentrations were lower in infants than in adults. Hepatic carbohydrate metabolites (glucose, maltose, and mannose) were higher, whereas amino acids (glutamine, leucine, methionine, phenylalanine, tyrosine, and valine) were lower in infant mice than in adult mice. The concentrations of ascorbate, betaine, sarcosine, and ethanolamine were higher, whereas those of taurine, inosine, and O-phosphocholine were lower in infant mice than in adult mice. The differences in liver metabolites between the two groups could be due to differences in their developmental stages and dietary sources (breast milk for infants and laboratory chow for adults). The above results provide insights into the hepatic metabolism in infants; however, the exact implications of the findings require further investigation.
Keywords: 1H-NMR; adult; age difference; infant; liver; metabolite; metabolomics.
Conflict of interest statement
The authors have no conflict of interest to declare.
Figures


Similar articles
-
(1)H NMR based metabolomic profiling revealed doxorubicin-induced systematic alterations in a rat model.J Pharm Biomed Anal. 2016 Jan 25;118:338-348. doi: 10.1016/j.jpba.2015.10.026. Epub 2015 Oct 30. J Pharm Biomed Anal. 2016. PMID: 26595282
-
1D-¹H-nuclear magnetic resonance metabolomics reveals age-related changes in metabolites associated with experimental venous thrombosis.J Vasc Surg Venous Lymphat Disord. 2016 Apr;4(2):221-30. doi: 10.1016/j.jvsv.2015.09.010. Epub 2015 Nov 24. J Vasc Surg Venous Lymphat Disord. 2016. PMID: 26993871
-
Metabolic profiling of ob/ob mouse fatty liver using HR-MAS 1H-NMR combined with gene expression analysis reveals alterations in betaine metabolism and the transsulfuration pathway.Anal Bioanal Chem. 2017 Feb;409(6):1591-1606. doi: 10.1007/s00216-016-0100-1. Epub 2016 Nov 28. Anal Bioanal Chem. 2017. PMID: 27896396
-
Feeding the low-birth-weight infant: II. Effects of taurine and cholesterol supplementation on amino acids and cholesterol.Pediatrics. 1983 Feb;71(2):179-86. Pediatrics. 1983. PMID: 6823419
-
Metabolomic Signatures in Doxorubicin-Induced Metabolites Characterization, Metabolic Inhibition, and Signaling Pathway Mechanisms in Colon Cancer HCT116 Cells.Metabolites. 2022 Oct 31;12(11):1047. doi: 10.3390/metabo12111047. Metabolites. 2022. PMID: 36355130 Free PMC article.
Cited by
-
Variation in human gut microbiota impacts tamoxifen pharmacokinetics.mBio. 2025 Jan 8;16(1):e0167924. doi: 10.1128/mbio.01679-24. Epub 2024 Nov 25. mBio. 2025. PMID: 39584836 Free PMC article.
References
-
- Croom E. Metabolism of xenobiotics of human environments. Prog. Mol. Biol. Transl. Sci. 2012;112:31–88. - PubMed
Grants and funding
LinkOut - more resources
Full Text Sources
