

The Beneficial Effect of a Healthy Dietary Pattern on Androgen Deprivation Therapy-Related Metabolic Abnormalities in Patients with Prostate Cancer: A Meta-Analysis Based on Randomized Controlled Trials and Systematic Review
- PMID: 36295871
- PMCID: PMC9611951
- DOI: 10.3390/metabo12100969
The Beneficial Effect of a Healthy Dietary Pattern on Androgen Deprivation Therapy-Related Metabolic Abnormalities in Patients with Prostate Cancer: A Meta-Analysis Based on Randomized Controlled Trials and Systematic Review
Abstract
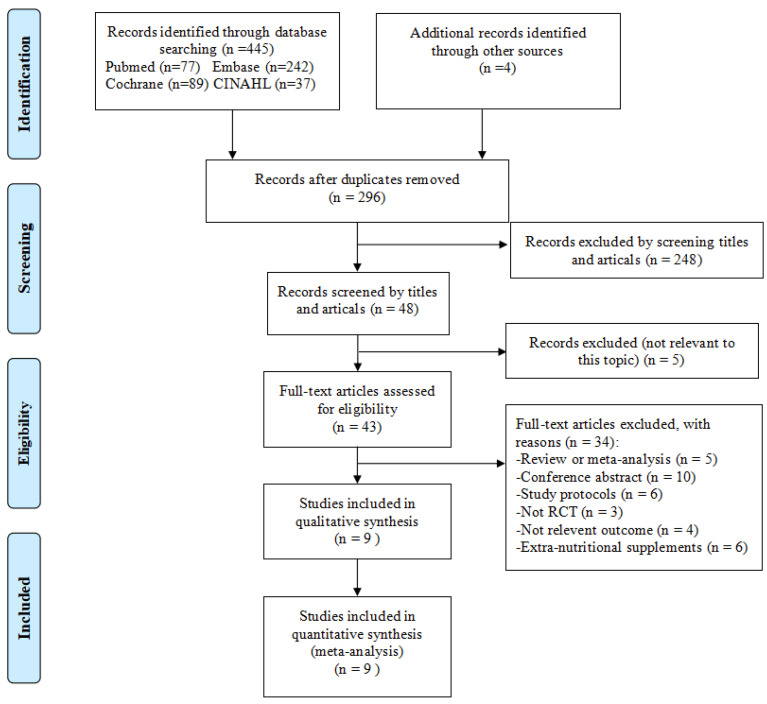
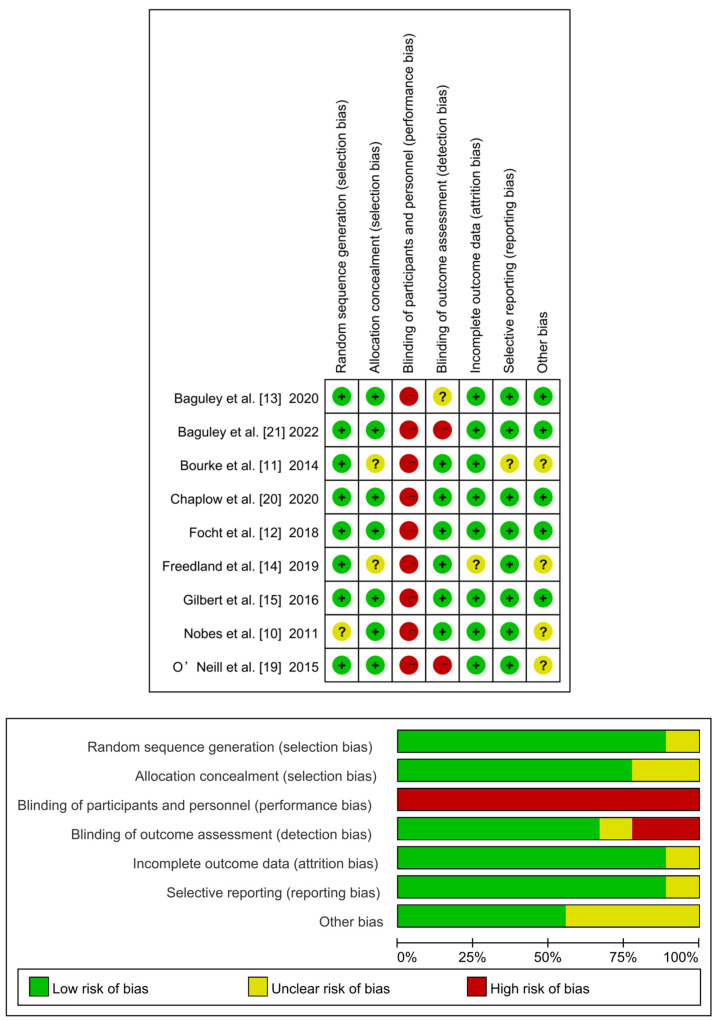
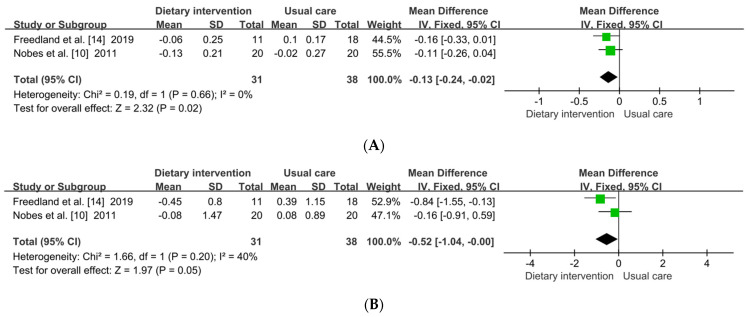
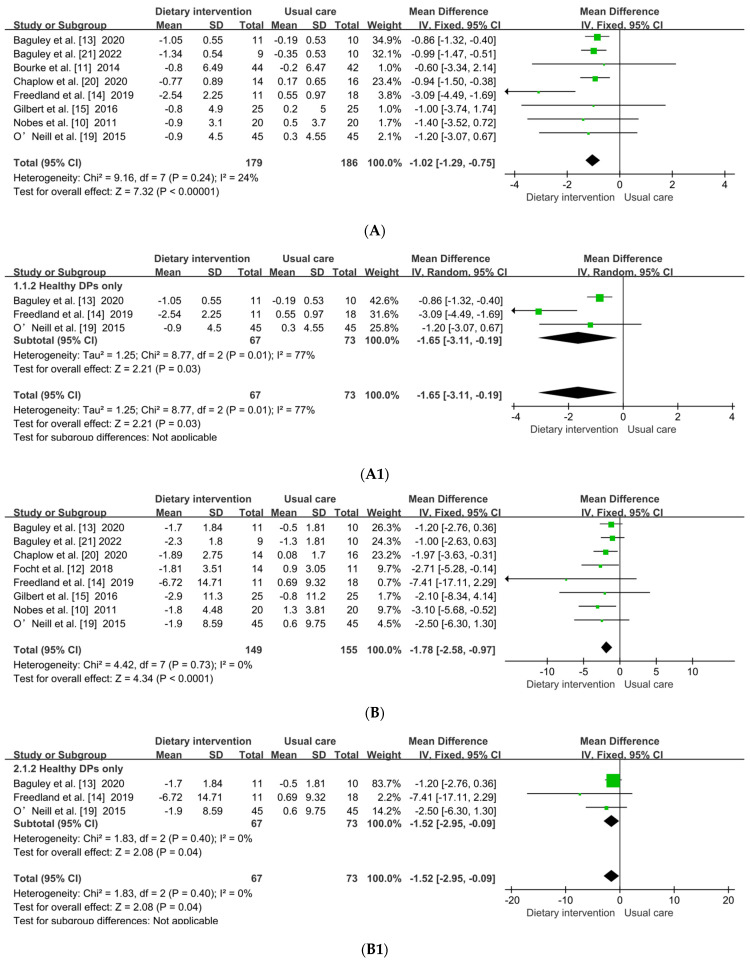
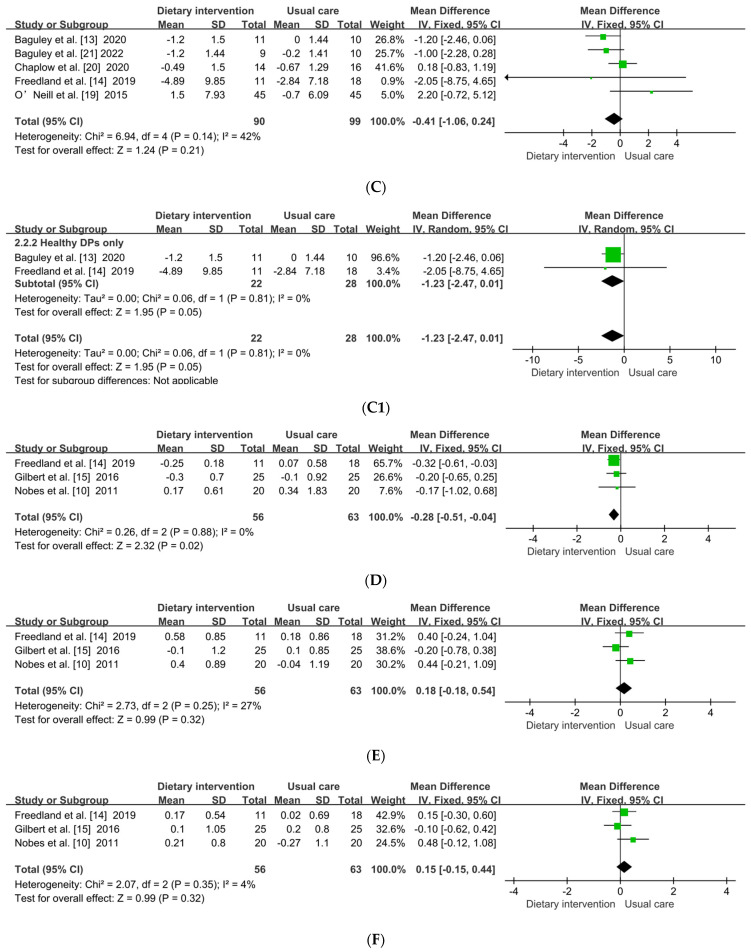
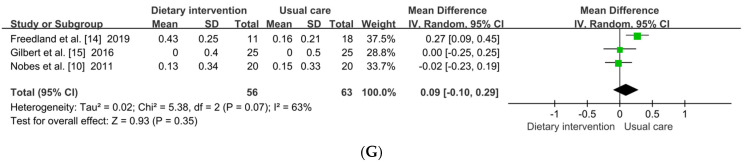
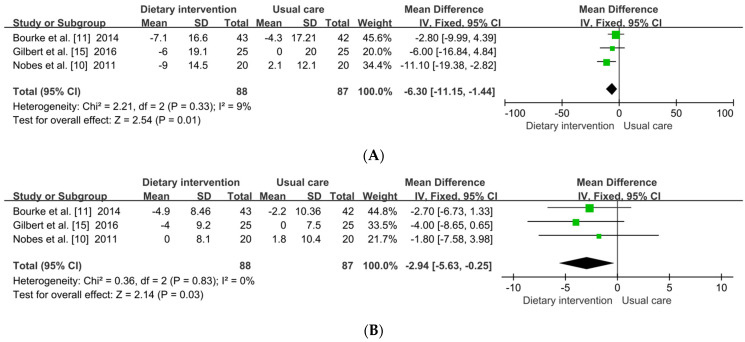
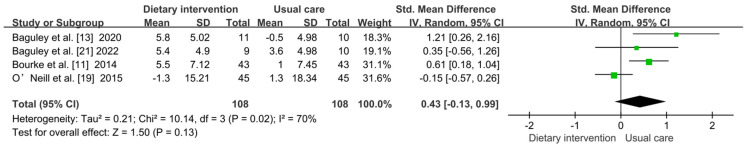
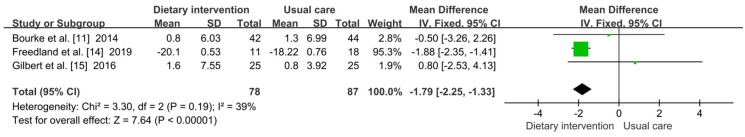
Metabolic abnormalities as side effects of androgen-deprivation therapy (ADT) can accelerate progression of prostate cancer (PCa) and increase risks of cardiovascular diseases. A healthy dietary pattern (DP) plays an important role in regulating glycolipid metabolism, while evidence about DP on ADT-related metabolic abnormalities is still controversial. To explore the effect of DP on metabolic outcomes in PCa patients with ADT, PubMed, Embase, Cochrane, and CINAHL were searched from inception to 10 September 2022. Risk of biases was evaluated through Cochrane Collaboration’s Tool. If heterogeneity was low, the fixed-effects model was carried out; otherwise, the random-effects model was used. Data were determined by calculating mean difference (MD) or standardized MD (SMD) with 95% confidence intervals (CIs). Nine studies involving 421 patients were included. The results showed that healthy DP significantly improved glycated hemoglobin (MD: −0.13; 95% CI: −0.24, −0.02; p = 0.020), body mass index (MD: −1.02; 95% CI: −1.29, −0.75; p < 0.001), body fat mass (MD: −1.78; 95% CI: −2.58, −0.97; p < 0.001), triglyceride (MD: −0.28; 95% CI: −0.51, −0.04; p = 0.020), systolic blood pressure (MD: −6.30; 95% CI: −11.15, −1.44; p = 0.010), and diastolic blood pressure (MD: −2.94; 95% CI: −5.63, −0.25; p = 0.030), although its beneficial effects on other glycolipid metabolic indicators were not found. Additionally, a healthy DP also lowered the level of PSA (MD: −1.79; 95% CI: −2.25, −1.33; p < 0.001). The meta-analysis demonstrated that a healthy DP could improve ADT-related metabolic abnormalities and be worthy of being recommended for PCa patients with ADT.
Keywords: androgen-deprivation therapy; dietary patterns; metabolic abnormalities; prostate cancer; prostate-specific antigen.
Conflict of interest statement
The authors declare no conflict of interest.
Figures
Similar articles
-
The effects of resistance exercise on body composition and physical function in prostate cancer patients undergoing androgen deprivation therapy: an update systematic review and meta-analysis.Aging Male. 2022 Dec;25(1):281-292. doi: 10.1080/13685538.2022.2146670. Aging Male. 2022. PMID: 36382930
-
Exercise overcome adverse effects among prostate cancer patients receiving androgen deprivation therapy: An update meta-analysis.Medicine (Baltimore). 2017 Jul;96(27):e7368. doi: 10.1097/MD.0000000000007368. Medicine (Baltimore). 2017. PMID: 28682886 Free PMC article. Review.
-
The Effect of the Mediterranean Diet on Metabolic Health: A Systematic Review and Meta-Analysis of Controlled Trials in Adults.Nutrients. 2020 Oct 30;12(11):3342. doi: 10.3390/nu12113342. Nutrients. 2020. PMID: 33143083 Free PMC article.
-
Lifestyle interventions to alleviate side effects on prostate cancer patients receiving androgen deprivation therapy: a meta-analysis.Jpn J Clin Oncol. 2018 Sep 1;48(9):827-834. doi: 10.1093/jjco/hyy101. Jpn J Clin Oncol. 2018. PMID: 30053039
-
The Effects of Statins on Prostate Cancer Patients Receiving Androgen Deprivation Therapy or Definitive Therapy: A Systematic Review and Meta-Analysis.Pharmaceuticals (Basel). 2022 Jan 22;15(2):131. doi: 10.3390/ph15020131. Pharmaceuticals (Basel). 2022. PMID: 35215243 Free PMC article. Review.
Cited by
-
Trends in research on dietary behavior and cardiovascular disease from 2002 to 2022: a bibliometric analysis.Front Nutr. 2023 Jun 5;10:1147994. doi: 10.3389/fnut.2023.1147994. eCollection 2023. Front Nutr. 2023. PMID: 37342553 Free PMC article.
-
Effectiveness of Treatments That Alter Metabolomics in Cancer Patients-A Systematic Review.Cancers (Basel). 2023 Aug 28;15(17):4297. doi: 10.3390/cancers15174297. Cancers (Basel). 2023. PMID: 37686573 Free PMC article. Review.
-
Efficacy and Safety of Neoadjuvant Luteinizing Hormone-Releasing Hormone Antagonist and Tegafur-Uracil Chemohormonal Therapy for High-Risk Prostate Cancer.Life (Basel). 2023 Apr 23;13(5):1072. doi: 10.3390/life13051072. Life (Basel). 2023. PMID: 37240717 Free PMC article.
References
-
- Mohler J.L., Antonarakis E.S., Armstrong A.J., D’Amico A.V., Davis B.J., Dorff T., Eastham J.A., Enke C.A., Farrington T.A., Higano C.S., et al. Prostate Cancer, Version 2.2019, NCCN Clinical Practice Guidelines in Oncology. J. Natl. Compr. Cancer Netw. 2019;17:479–505. doi: 10.6004/jnccn.2019.0023. - DOI - PubMed
-
- Cai Jianliang D., Gang S.H. Review on metabolism and nutrition after androgen deprivation therapy in prostate patients. Electron. J. Metab. Nutr. Cancer. 2020;2:236–239.
Publication types
Grants and funding
LinkOut - more resources
Full Text Sources
Research Materials
Miscellaneous
