. 2022 Oct 19;12(10):992.
doi: 10.3390/metabo12100992.

Cluster Analysis Statistical Spectroscopy for the Identification of Metabolites in 1H NMR Metabolomics

Affiliations

Cluster Analysis Statistical Spectroscopy for the Identification of Metabolites in 1H NMR Metabolomics

Silke S Heinzmann et al. Metabolites. .

Abstract

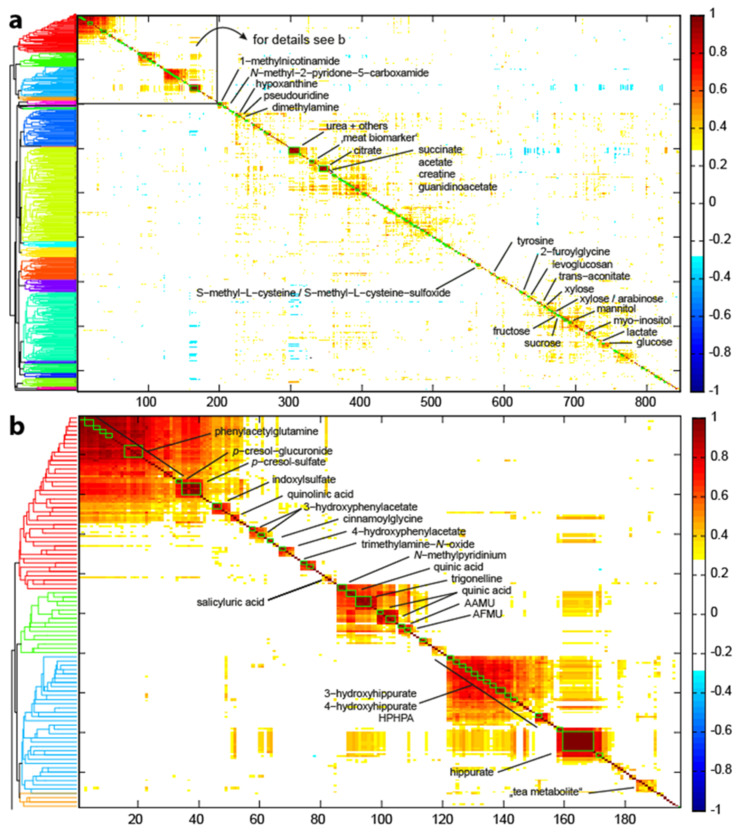
Metabolite identification in non-targeted NMR-based metabolomics remains a challenge. While many peaks of frequently occurring metabolites are assigned, there is a high number of unknowns in high-resolution NMR spectra, hampering biological conclusions for biomarker analysis. Here, we use a cluster analysis approach to guide peak assignment via statistical correlations, which gives important information on possible structural and/or biological correlations from the NMR spectrum. Unknown peaks that cluster in close proximity to known peaks form hypotheses for their metabolite identities, thus, facilitating metabolite annotation. Subsequently, metabolite identification based on a database search, 2D NMR analysis and standard spiking is performed, whereas without a hypothesis, a full structural elucidation approach would be required. The approach allows a higher identification yield in NMR spectra, especially once pathway-related subclusters are identified.

Keywords: NMR spectroscopy; metabolite identification; metabolomics; urine.


Conflict of interest statement

The authors declare no conflict of interest.

Figures

Figure 1
Figure 1
Overview of the standard operating procedures workflow.
Figure 2
Figure 2
Overview of the CLASSY approach adopted from Robinette et al. Input data includes data samples and a QC sample. A peak-picking approach with the QC sample as reference generates the peak list. The CLASSY approach is comprised of a local clustering that finds peaks that cluster (Spearman correlation, see green boxes in the CLASSY clustering output figure also in Figure 3) and a global clustering based on HCA analysis for re-arrangement of the local clusters. The CLASSY output figure gives information on the peak clusters (green boxes), the exact correlation coefficient (colour-code red to blue) and a HCA dendrogram of all re-arranged peak clusters.
Figure 3
Figure 3
(a) Overview of all metabolite correlations from the 846 picked peaks. The x and y axis give the position of the peak in the metabolite correlation CLASSY cluster. Superimposed are the correlation coefficients, ranging from −1 to 1 (−1 (blue) to 1 (red), the area with small correlation coefficients, i.e., −0.3 to 0.3 is excluded (white)). The dendrogram (colour threshold 0.45) on the left highlights clusters. (b) The microbial metabolite cluster (from box in (a)) summarizes metabolites from amino acid breakdown (red dendrogram branch), from coffee consumption (green branch) and hippurate and hydroxy-hippurate metabolites (blue branch). The chemical shifts of the associated metabolites are listed in Supplemental Table S1.

References

    1. Robinette S.L., Lindon J.C., Nicholson J.K. Statistical Spectroscopic Tools for Biomarker Discovery and Systems Medicine. Anal. Chem. 2013;85:5297–5303. doi: 10.1021/ac4007254. - DOI - PubMed
    1. Dona A.C., Kyriakides M., Scott F., Shephard E.A., Varshavi D., Veselkov K., Everett J.R. A Guide to the Identification of Metabolites in NMR-Based Metabonomics/Metabolomics Experiments. Comput. Struct. Biotechnol. J. 2016;14:135–153. doi: 10.1016/j.csbj.2016.02.005. - DOI - PMC - PubMed
    1. Bouatra S., Aziat F., Mandal R., Guo A.C., Wilson M.R., Knox C., Bjorndahl T.C., Krishnamurthy R., Saleem F., Liu P., et al. The Human Urine Metabolome. PLoS ONE. 2013;8:e73076. doi: 10.1371/journal.pone.0073076. - DOI - PMC - PubMed
    1. Psychogios N., Hau D.D., Peng J., Guo A.C., Mandal R., Bouatra S., Sinelnikov I., Krishnamurthy R., Eisner R., Gautam B., et al. The Human Serum Metabolome. PLoS ONE. 2011;6:e16957. doi: 10.1371/journal.pone.0016957. - DOI - PMC - PubMed
    1. Robinette S.L., Veselkov K.A., Bohus E., Coen M., Keun H.C., Ebbels T.M.D., Beckonert O., Holmes E.C., Lindon J.C., Nicholson J.K. Cluster Analysis Statistical Spectroscopy Using Nuclear Magnetic Resonance Generated Metabolic Data Sets from Perturbed Biological Systems. Anal. Chem. 2009;81:6581–6589. doi: 10.1021/ac901240j. - DOI - PubMed

LinkOut - more resources