. 2022 Oct 12;13(10):1720.
doi: 10.3390/mi13101720.

Design and High-Resolution Analysis of an Efficient Periodic Split-and-Recombination Microfluidic Mixer

Affiliations

Design and High-Resolution Analysis of an Efficient Periodic Split-and-Recombination Microfluidic Mixer

Xiannian Zhang et al. Micromachines (Basel). .

Abstract

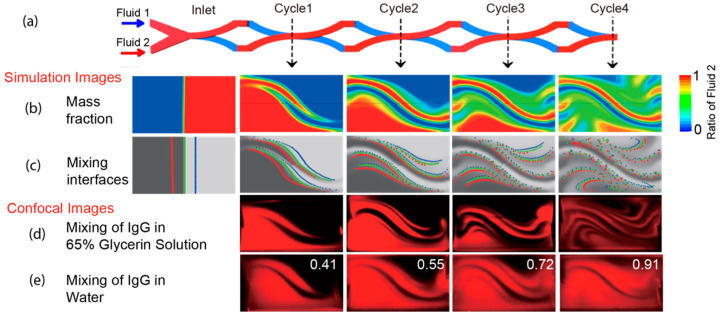
We developed a highly efficient passive mixing device based on a split-and-recombine (SAR) configuration. This micromixer was constructed by simply bonding two identical microfluidic periodical open-trench patterns face to face. The structure parameters of periodical units were optimized through numerical simulation to facilitate the mixing efficiency. Despite the simplicity in design and fabrication, it provided rapid mixing performance in both experiment and simulation conditions. To better illustrate the mixing mechanism, we developed a novel scheme to achieve high-resolution confocal imaging of serial channel cross-sections to accurately characterize the mixing details and performance after each SAR cycle. Using fluorescent IgG as an indicator, nearly complete mixing was achieved using only four SAR cycles in an aqueous solution within a device's length of less than 10 mm for fluids with a Péclet number up to 8.7 × 10⁴. Trajectory analysis revealed that each SAR cycle transforms the input fluids using three synergetic effects: rotation, combination, and stretching to increase the interfaces exponentially. Furthermore, we identified that the pressure gradients in the parallel plane of the curved channel induced vertical convection, which is believed to be the driving force underlying these effects to accelerate the mixing process.

Keywords: lab-on-chip; microfabrication; microfluidic mixer; uTAS.


Conflict of interest statement

The authors declare no conflict of interest.

Figures

Figure 1
Figure 1
Schematic and fabrication of the mixer. (a) The 3D structure diagram of a mixer with two inlets and four SAR mixing cycles. (b) One cycle of the mixer that is constructed with two layers of microchannels. (c) Key structure parameters for the single unit of a mixer. (d) Image of a mixer with the channel filled with colorant. (e) Fabrication process of the mixer device.
Figure 2
Figure 2
Method for high-resolution imaging of the fluid mixing distribution on cross-sections of the outlet of serial mixing cycles with high resolution. (a) Procedures to make the side surface of the chip optically transparent for observing the mixer outlet cross-sections. The extra marginal PDMS near the outlet was cut and removed. The exposed blurry surface was further attached to a thin layer of uncured PDMS. After the crosslinking, the chip was peeled off from the wafer with a transparent outlet surface exposed. (b) Setup for imaging the cross-section of the chip’s channel outlets of the first four cycle numbers (red numbers) with confocal microscopy.
Figure 3
Figure 3
Optimization of mixer structure parameters and mixing ratio. (a) Mixing process during the first four cycles of the mixer. (b) For each radius R (in µm), the mixing ratio of the first four cycles is calculated. The length represents the distance from the inlet to the outlet for each of the first four cycles. (c) The mixing ratio with different channel height when W = 100 μm, θ = 45°, R = 600 μm, L = 100 μm.
Figure 4
Figure 4
Simulation analysis and confocal images of the mixer in cross-sections of the first four cycles. (a) The schematic of input fluids and four outlet planes from 1–4 mixing cycles. (b) Simulated mass fraction distributions (calculated as the ratio of Fluid 2) of each outlet plane. (c) The growing number and length of mixing interfaces, which are traced and visualized using three sets of dots (colored in red, green, and blue) from the boundaries of two fluids at the inlet plane. (d) Confocal images of four outlet planes for mixing of IgG in 65% glycerin solutions. The interfaces are clearly visualized due to the slow protein diffusion in glycerin. (e) The confocal images of four planes for mixing IgG in water with the calculated mixing index labeled.
Figure 5
Figure 5
The relationship between mixing ratio after 4 cycles and flow velocity.
Figure 6
Figure 6
Three mixing effects in the mixing unit. Specific sections or zones from Fluid 1 and Fluid 2 inputs are colored brown and green, respectively. These zones are transformed in separation, layer switch, and recombination stages in the mixing unit/cycle.
Figure 7
Figure 7
The inlet plane is composed of four mixing zone groups, which are fully mixed in different cycles sequentially. For each mixing zone group, its Fluid 1 and Fluid 2 sections are colored brown and green, respectively. The transformation and reallocation of fluid distributions in the first four mixing cycles are visualized accordingly.
Figure 8
Figure 8
Mechanism of advection between overlapped curvature channels. (a) Schematic of pressure distribution in the inlet, outlet, radial plane, and parallel planes from the Split (upper) and Recombination (lower) stage of the mixing process. The pressure gradients in the parallel planes are different depending on the mixing stage. (b) The pressure gradient of parallel planes from overlapped channels induces advection between them, and the direction is consistent with separation and combination parts.

Similar articles

References

    1. Hou X., Zhang Y.S., Santiago G.T.-d., Alvarez M.M., Ribas J., Jonas S.J., Weiss P.S., Andrews A.M., Aizenberg J., Khademhosseini A., et al. Interplay between materials and microfluidics. Nat. Rev. Mater. 2017;2:17016. doi: 10.1038/natrevmats.2017.16. - DOI - PMC - PubMed
    1. Sackmann E.K., Fulton A.L., Beebe D.J. The present and future role of microfluidics in biomedical research. Nature. 2014;507:181–189. doi: 10.1038/nature13118. - DOI - PubMed
    1. Streets A.M., Huang Y.Y. Chip in a lab: Microfluidics for next generation life science research. Biomicrofluidics. 2013;7:11302. doi: 10.1063/1.4789751. - DOI - PMC - PubMed
    1. Nasseri B., Soleimania N., Rabieec N., Kalbasi A., Karimi M., Hamblin M.R. Point-of-care microfluidic devices for pathogen detection. Biosens. Bioelectron. 2018;117:112–128. doi: 10.1016/j.bios.2018.05.050. - DOI - PMC - PubMed
    1. Park J., Han D.H., Park J.-K. Towards practical sample preparation in point-of-care testing: User-friendly microfluidic devices. Lab Chip. 2020;20:1191–1203. doi: 10.1039/D0LC00047G. - DOI - PubMed

LinkOut - more resources