. 2022 Sep 25;10(10):1901.
doi: 10.3390/microorganisms10101901.

Intronization Signatures in Coding Exons Reveal the Evolutionary Fluidity of Eukaryotic Gene Architecture

Affiliations

Intronization Signatures in Coding Exons Reveal the Evolutionary Fluidity of Eukaryotic Gene Architecture

Judith Ryll et al. Microorganisms. .

Abstract

The conventionally clear distinction between exons and introns in eukaryotic genes is actually blurred. To illustrate this point, consider sequences that are retained in mature mRNAs about 50% of the time: how should they be classified? Moreover, although it is clear that RNA splicing influences gene expression levels and is an integral part of interdependent cellular networks, introns continue to be regarded as accidental insertions; exogenous sequences whose evolutionary origin is independent of mRNA-associated processes and somewhat still elusive. Here, we present evidence that aids to resolve this disconnect between conventional views about introns and current knowledge about the role of RNA splicing in the eukaryotic cell. We first show that coding sequences flanked by cryptic splice sites are negatively selected on a genome-wide scale in Paramecium. Then, we exploit selection intensity to infer splicing-related evolutionary dynamics. Our analyses suggest that intron gain begins as a splicing error, involves a transient phase of alternative splicing, and is preferentially completed at the 5' end of genes, which through intron gain can become highly expressed. We conclude that relaxed selective constraints may promote biological complexity in Paramecium and that the relationship between exons and introns is fluid on an evolutionary scale.

Keywords: RNA splicing; alternative splicing; exon; exonization; gene architecture; gene expression; intron; intronization; purifying selection.


Conflict of interest statement

The authors declare no conflict of interest. The funders had no role in the design of the study; in the collection, analyses, or interpretation of data; in the writing of the manuscript, or in the decision to publish the results.

Figures

Figure 1
Figure 1
Intronization signature in the Paramecium genome. Top: Size distribution of annotated introns. The 94,711 CDS introns in Paramecium are extremely short, very narrowly distributed, and depleted in sizes that are a multiple of 3. Configurations with GTA and TAG at the 5’ and 3’ splice sites, respectively, (black) are more prevalent than all non-GTA|TAG configurations (light salmon) taken together. Bottom: DNA strand asymmetry (DSA) values of GT|AG coding sequences. GTA|TAG (black), but not non-GTA|TAG (light salmon) exonic segments, are counter-selected (as indicated by their negative DSA values) in the size range where annotated introns are most common. This counter-selection is especially pronounced when their size is a multiple of 3. Only introns between 15 and 40 nt, which comprise >99% of them, are shown.
Figure 2
Figure 2
DNA strand asymmetry (DSA) variation along genes and between levels of gene expression. (A) Intronization signature in coding exons according to their position along genes. Top: DSA values for first exons (blue), internal exons (yellow), and last exons (grey). Bottom: Within the range of prevalent intron sizes (21–30 bp), 3n (turquoise) GTA|TAG coding sequences have lower DSA values than their 3n + 1 (mustard yellow) and 3n + 2 (red) counterparts, irrespective of the positional class of their exon. (B) Intronization signature in exons according to the expression level of their gene. Top: DSA values of GTA|TAG coding sequences in highly (dark violet) and weakly (yellow) expressed genes. Bottom: In both highly and weakly expressed genes, 3n (turquoise) GTA|TAG coding sequences in the prevalent intron size range (21–30 bp) display more negative DSA values than 3n + 1 (mustard yellow) and 3n + 2 (red) ones. *** p-value < 0.0001; * p-value < 0.05 (t-test; Bonferroni corrected).
Figure 3
Figure 3
Splicing levels of GTA|TAG coding sequences. Stacked bar heights represent the percentage of spliced sequences in each splicing level class (one of ten equal-width bins, e.g., bins 1 and 2 represent the splicing level intervals (0, 0.1] and (0.1, 0.2], respectively). Only loci covered by at least ten reads are considered. Solid and dashed bar parts (colored in black or red for the two surveyed replicates) correspond to 3n and non-3n spliced sequences, respectively. Further, the green and blue line plots show the relative fraction of 3n sequences and the AT content of the spliced sequences per splicing level class, respectively (mean +/− standard deviation of the two replicates in both cases).
Figure 4
Figure 4
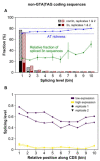
Splicing-related features of spliced coding sequences and annotated introns along genes with different expression levels in Paramecium. For both weakly (A) and highly (B) expressed genes, CDS was divided into ten bins of equal width and the fraction of coding sequences with evidence of splicing (in at least one of the two surveyed replicates) out of all spliced and un-spliced GT|AG coding sequences in each bin was determined. The numbers within the bars correspond to the proportion (expressed in percentage) of coding sequences whose length is a multiple of 3. Irrespective of the gene expression level, the fraction of spliced coding sequences is not uniformly distributed along genes (low expression: χ2 = 48.42, df = 9, p = 2.13 × 10⁻⁷; high expression: χ2 = 122.57, df = 9, p < 2.2 × 10⁻¹⁶). The relative fraction of spliced GTA|TAG coding sequences (black portion of bars) is larger in weakly (A) than in highly expressed genes (B) (46% vs. 27%, respectively; proportion test, p < 2.2 × 10⁻¹⁶). (C) Average splicing levels of spliced GTA|TAG coding sequences in each bin along the CDS are depicted for weakly (dark violet) and highly (yellow) expressed genes. Both the gene expression level and the relative position along the CDS vary with the splicing level of GTA|TAG coding sequences. When comparing (C) with (D), the spatial distribution of annotated GTA|TAG introns resembles the spatial distribution of spliced GTA|TAG coding sequences. In contrast, the relative excess of spliced GTA|TAG coding sequences in weakly expressed genes is inconsistent with the relative deficit of annotated introns in weakly expressed genes.
Figure 5
Figure 5
Relationships between expression and architectural properties of genes in Paramecium. (A) Intron density increases with gene expression level. The number of introns per kilobase of coding sequence, i.e., the intron density, was determined for genes of different expression level quartiles (Q1 to Q4). Median intron density (red lines in boxes) is smallest in weakly expressed genes (dark violet, Q1) and greatest in highly expressed genes (yellow, Q4) (2.0 vs. 2.8 introns per kb of coding sequence in weakly and highly expressed genes, respectively; Wilcoxon rank sum test, p < 2.2 × 10⁻¹⁶). (B) CDS length in Paramecium decreases with the expression level of the gene. In highly expressed genes (yellow, Q4), median CDS length (red line in box) is shorter and CDS length varies less than in genes of other expression level quartiles (987 vs. 1119 bp in highly and weakly expressed genes, respectively; Wilcoxon rank sum test, p < 2.2 × 10⁻¹⁶). (C) The retention level of internal GTA|TAG introns decreases with gene expression level. Introns with non-zero retention in at least one of the two studied replicates were grouped by the expression level of their gene. Boxes show the average retention levels of the two replicates for each of these introns. In weakly expressed genes (dark violet, Q1), retention levels vary considerably more, and median retention (red line in boxes) is higher than in genes of the other expression quartiles. (D) Length variation of Paramecium exons according to their position (first, internal, or last; colored in blue, yellow and grey, respectively) and expression level quartile of their gene (x-axis, Q1 to Q4). Only genes with at least 3 exons are considered. Exons tend to be shortest and exon length most narrowly distributed in highly expressed genes (Q4), irrespective of the exon’s position in the gene. Across different expression levels, the median length of internal exons varies less than it does in first and last exons, as indicated by the coefficient of variation around the medians in the legend. With increasing expression level, the median size (red line inside boxes) of internal exons converges to ~200 bp (marked by the black horizontal line)—which is also the distance between true introns and potentially cryptic introns, around which the latter experience the highest levels of splicing. (AD) Outliers have been omitted for visualization purposes.
Figure 6
Figure 6
Splicing-related features of GTA|TAG annotated introns and spliced coding sequences in the internal regions of Paramecium genes (A) The retention level of annotated internal GTA|TAG introns varies with between-intron distance. Average retention levels were determined for introns with non-zero retention in at least one of the two studied replicates, after grouping introns according to the distance between their 3′ss and the 5′ss of the next downstream intron. Introns that are located very closely to one another (leftmost box) have higher retention levels than introns located ~200 bp apart. (B) The splicing level of internal GTA|TAG coding sequences varies with the distance to the next downstream intron. GTA|TAG internal coding sequences with evidence of splicing in at least one of the two surveyed replicates were classified according to the distance between their 3′ end and the 5′ss of the following annotated intron. The average splicing level of the two replicates was then determined. Median splicing level (red line in boxes) is highest when this distance is ~200 bp. (A,B) Outliers have been omitted for visualization purposes.
Figure 7
Figure 7
Spatial distribution of PTC-containing introns in relation to gene expression levels. Fraction of PTC-containing GTA|TAG (A,B) and non-GTA|TAG (C,D) introns in different positional (first, internal, and last in genes with >2 introns) and length (3n, 3n + 1 or 3n + 2) classes for genes with low (A,C) and high (B,D) expression levels. Introns that belong to the 3n length class are more often PTC-containing than those of the other two length classes, irrespective of their position, their splicing signals, or the expression level of their gene, and 3n and PTC-containing introns occur more frequently at the gene 5’ end of highly expressed genes than weakly expressed genes, when they have strong (B vs. A) but not weak (D vs. C) splicing signals.
Figure 8
Figure 8
Distribution of last introns along the gene tail (arbitrary region: <200 bp). (A) In highly expressed genes (yellow), GTA-flanked introns less often reside in immediate vicinity to the gene 3′end than in lowly expressed genes (dark violet). (B) Last introns with a GTA 5′ splice site (black) tend to reside further away from the gene 3′end than those with a non-GTA 5′ splice site (light salmon).
Figure 9
Figure 9
Splicing levels of non-GTA|TAG coding sequences. (A) Stacked bar heights represent the percentage of spliced sequences in each splicing level class (one of ten equal-width bins, e.g., bins 1 and 2 represent the splicing level intervals (0, 0.1] and (0.1, 0.2], respectively). Only loci covered by at least ten reads are considered. Solid and dashed bar parts (colored in black or red for the two surveyed replicates) correspond to 3n and non-3n spliced sequences, respectively. Further, the green and blue line plots show the relative fraction of 3n sequences and the AT content of the spliced sequences per splicing level class, respectively (mean +/- standard deviation of the two replicates in both cases). (B) Average splicing levels of spliced non-GTA|TAG coding sequences in each bin along the CDS were obtained for weakly (dark violet) and highly (yellow) expressed genes. Both the gene expression level and the relative position along the CDS vary with the splicing level of non-GTA|TAG coding sequences.
Figure 10
Figure 10
Strong cryptic splice signals are counter-selected in the vicinity of annotated introns. (A) DNA strand asymmetry (DSA) scores of the GTA trinucleotide in the 15 nucleotides (nt) upstream of the annotated 5′ splice site (5′ss). DSA values are most negative directly upstream of the canonical 5′ss and increase with increasing distance, suggesting that the selective pressure is highest directly adjacent to the annotated 5′ss. (B) DSA scores of the TAG trinucleotide in the 15 nt downstream of the annotated 3′ splice site (3′ss). Similar to 5′ss, negative selection is strongest in the immediate vicinity of the annotated 3′ss. However, the signature of counter-selection against cryptic TAGs affects only ~10 nt downstream of the true 3′ss and is almost exclusively limited to distances that would enlarge the intron by 3n nucleotides.

Similar articles

Cited by

References

    1. Berget S.M., Moore C., Sharp P.A. Spliced Segments at 5′ Terminus of Adenovirus 2 Late Messenger-Rna. Proc. Natl. Acad. Sci. USA. 1977;74:3171–3175. doi: 10.1073/pnas.74.8.3171. - DOI - PMC - PubMed
    1. Chow L.T., Gelinas R.E., Broker T.R., Roberts R.J. Amazing Sequence Arrangement at 5′ Ends of Adenovirus-2 Messenger-Rna. Cell. 1977;12:1–8. doi: 10.1016/0092-8674(77)90180-5. - DOI - PubMed
    1. Gilbert W. Why Genes in Pieces. Nature. 1978;271:501. doi: 10.1038/271501a0. - DOI - PubMed
    1. Keren H., Lev-Maor G., Ast G. Alternative Splicing and Evolution: Diversification, Exon Definition and Function. Nat. Rev. Genet. 2010;11:345–355. doi: 10.1038/nrg2776. - DOI - PubMed
    1. Wilkinson M.E., Charenton C., Nagai K. RNA Splicing by the Spliceosome. Annu. Rev. Biochem. 2020;89:359–388. doi: 10.1146/annurev-biochem-091719-064225. - DOI - PubMed

LinkOut - more resources