. 2022 Oct 12;10(10):2011.
doi: 10.3390/microorganisms10102011.

Paracoccidioides lutzii Formamidase Contributes to Fungal Survival in Macrophages

Affiliations

Paracoccidioides lutzii Formamidase Contributes to Fungal Survival in Macrophages

Lana O'Hara Souza Silva et al. Microorganisms. .

Abstract

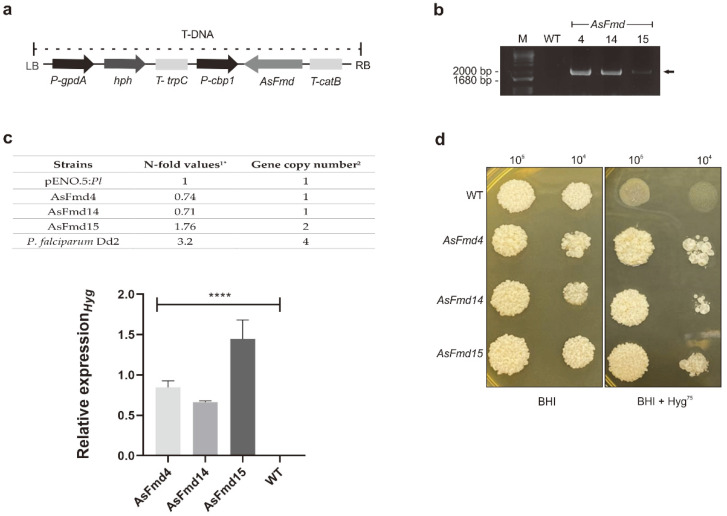
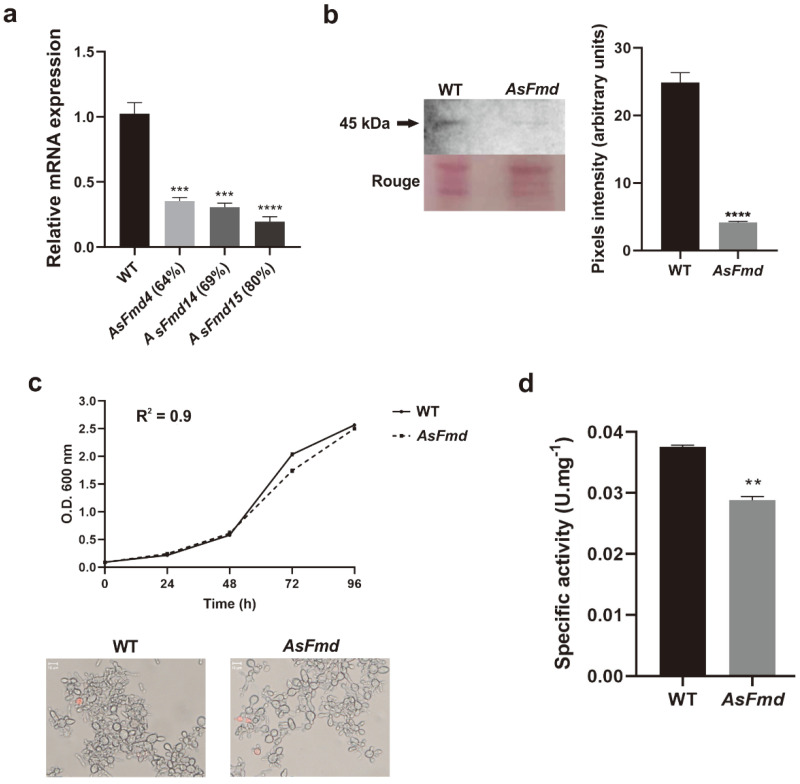
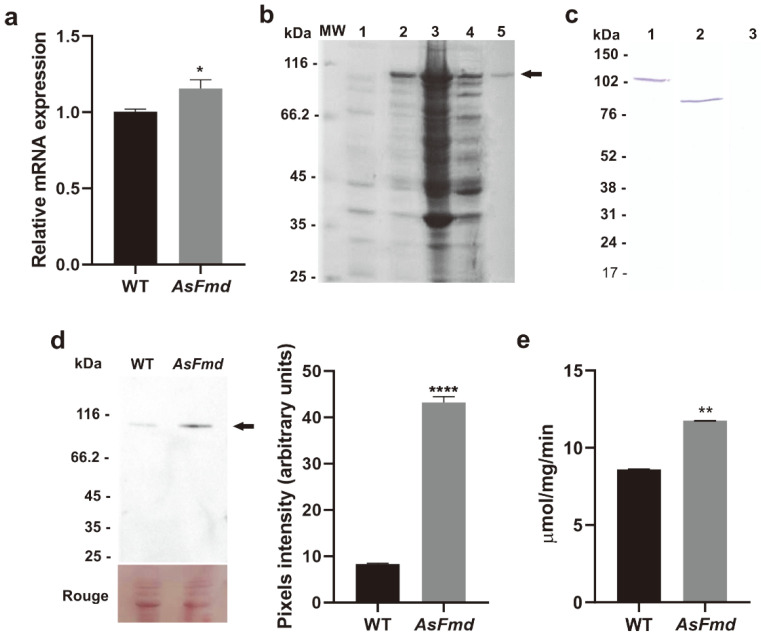
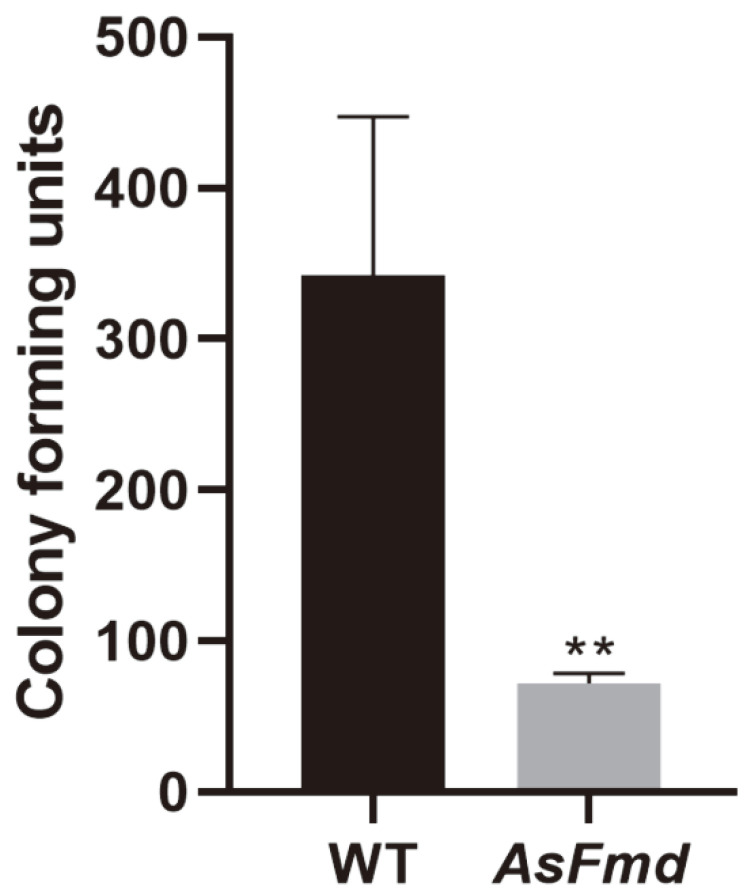
Nitrogen is a crucial nutrient for microorganisms that compose essential biomolecules. However, hosts limit this nutrient as a strategy to counter infections, therefore, pathogens use adaptive mechanisms to uptake nitrogen from alternative sources. In fungi, nitrogen catabolite repression (NCR) activates transcription factors to acquire nitrogen from alternative sources when preferential sources are absent. Formamidase has been related to nitrogen depletion in Aspergillus nidulans through formamide degradation to use the released ammonia as a nitrogen source. In Paracoccidioides spp., formamidase is highly expressed in transcriptomic and proteomic analyses. Here, we aim to investigate the importance of formamidase to Paracoccidioides lutzii. Thereby, we developed a P. lutzii silenced strain of fmd gene (AsFmd) by antisense RNA technology using Agrobacterium tumefaciens-mediated transformation (ATMT). The AsFmd strain led to increased urease expression, an enzyme related to nitrogen assimilation in other fungi, suggesting that P. lutzii might explore urease as an alternative route for ammonia metabolism as a nitrogen source. Moreover, formamidase was important for fungal survival inside macrophages, as fungal recovery after macrophage infection was lower in AsFmd compared to wild-type (WT) strain. Our findings suggest potential alternatives of nitrogen acquisition regulation in P. lutzii, evidencing formamidase influence in fungal virulence.

Keywords: gene silencing; macrophage infection; nitrogen catabolite repression; nitrogen depletion; virulence.


Conflict of interest statement

The authors declare no conflict of interest. The funders had no role in the design of the study; in the collection, analyses, or interpretation of data; in the writing of the manuscript; or in the decision to publish the results.

Figures

Figure 1
Figure 1
Confirmation of T-DNA integration into P. lutzii genome. (a) Schematic representation of the T-DNA generated for ATMT transformation. Antisense fmd fragment was constructed under control of calcium binding protein (cbp1) promoter of H. capsulatum, and catB terminator of A. fumigatus. Hygromycin-resistant gene (hph) was constructed under control of glyceraldehyde 3-phosphatate dehydrogenase (gpdA) promoter and trpC terminator of A. nidulans. (b) Confirmation of antisense plasmid integration on P. lutzii genome. Black arrow indicates the amplicon of 1800 bp on transformed strains. (c) Upper panel: Copy number of inserted Hygromycin into P. lutzii yeast cells accessed through qPCR. 1* N-Fold copy number of AsFmd silenced strains of P. lutzii in comparison to luciferase promotor gene pENO.5:Pl that harbors one copy of hygromycin gene [35] and P. falciparum Dd2 that contains 4 copy numbers of multidrug resistance protein pfmdr1 gene [36]. N-fold of P. lutzii was achieved by the average of triplicate of hygromycin expression levels. Hygromycin Ct values was normalized with enolase reference gene (PAAG_11169). 2 Linear regression was used for estimating the gene copy number in unknown silenced strains in relation to P. falciparum Dd2 [36] that contains 4 copy numbers and pENO.5:Pl that harbors one copy of hygromycin gene. The regression statistic was R2: 0,98 and Χ variable with standard error 0.09 and p ˂ 0.0008. Lower panel: Relative quantification of hygromycin expression in WT and AsFmd strains through RT-qPCR. The enolase gene (PAAG_11169) was used as endogenous control. Shapiro–Wilk test was employed to determine data normality (p values > 0.1). Statistical analyses from experimental triplicates were performed through one-way ANOVA. **** represents p values < 0.0001. (d) WT and AsFmd strains growth in the absence (first panel) or presence of hygromycin (75 μg/mL) (second panel). Cells were plated at 105 and 104 cells/mL concentrations. Images were obtained after 7 days of growth at 37 °C.
Figure 2
Figure 2
P. lutzii fmd gene silencing. (a): Relative quantification of fmd expression in WT and AsFmd strains through RT-qPCR. The tubulin gene (PAAG_03031) was used as endogenous control. (b): Fmd expression analysis in WT and AsFmd strains through immunoblotting. Rouge: WT and AsFmd protein extract stained with Rouge-Ponceau exhibiting similar protein quantification. Polyclonal antibody anti-PbFmd was incubated with 30 μg of protein extracts. Pixel intensity was measured by densitometric analysis of immunoblotting bands using ImageJ software. Pixel intensity from three replicates was measured by densitometric analysis of immunoblotting bands using ImageJ software. (c): Growth and viability of WT and AsFmd strains. WT and AsFmd strains were grown in BHI for 96 h. O.D. was measured daily at 600 nm to determine growth curve. Microscopy represents P. lutzii cell viability that was accessed by staining with propidium iodide (1 μg/mL) on the last day of the growth curve. Dead cells are colored in red. Images were obtained using an Axioscope A1 microscope (Carl Zeiss) at 493/623 nm and magnified 1000×. (d): Formamidase enzymatic activity in 500 ng of WT and AsFmd protein extract. Error bars represent standard deviation of three experimental replicates. Shapiro–Wilk test was employed to determine data normality: RT-qPCR (p values > 0.2), densitometric analysis of immunoblotting bands (p values > 0.2) and formamidase activity (p values > 0.8). Student’s t-test was applied for statistical analysis of relative quantification of fmd expression through RT-qPCR and densitometric analysis of immunoblotting bands. **** represents p values < 0.000, *** represents p values ≤ 0.0005 and ** represents p values ≤ 0.005.
Figure 3
Figure 3
Urease expression, immunoblotting, and enzymatic activity analysis. (a): Relative quantification of urease expression in WT and AsFmd strains through RT-qPCR. The tubulin gene (PAAG_03031) was used as endogenous control. Statistical analyses were performed through Student’s t-test. * represents p values < 0.05. (b): Heterologous expression and purification of recombinant urease analysis through SDS-PAGE. MW: protein molecular weight marker. 1: E. coli protein extract prior to IPTG induction. 2: Urease expression (arrow, 103 kDa) after 3 h of induction with 1.0 mM IPTG. 3: Pellet after cell lysis. 4: A 103 kDa protein, equivalent to urease size, on soluble supernatant after cell lysis. 5: Purified recombinant urease after affinity chromatography with NI-NTA AGAROSE resin. (c): Immunoblotting for anti-Ure antibody specificity test. 1: Incubation of anti-Ure (1:5000) with 10 μg of purified rUre, rendering a 103 kDa protein, equivalent to 83 kDa of PbUre fused to 20 kDa of His-tag. 2: Incubation of anti-Ure (1:5000) with 30 μg of P. lutzii total protein extracts. 3: Incubation of pre-immune serum (1:500) with 30 μg of P. lutzii total protein extracts. (d): Analysis of urease expression in WT and AsFmd strains through immunoblotting. The arrow indicates urease protein (85 kDa). Rouge: WT and AsFmd protein extract stained with Rouge-Ponceau exhibiting similar protein quantification. Pixel intensity was measured by densitometric analysis of immunoblotting bands from experimental triplicates using ImageJ software. (e): Urease enzymatic activity in 500 ng of WT and AsFmd protein extract. Shapiro–Wilk test was employed to determine data normality: RT-qPCR (p values > 0.4), densitometric analysis of immunoblotting bands (p values > 0.5) and urease activity (p values > 0.6). Student’s t-test was applied for statistical analysis of RT-qPCR, densitometric analysis of immunoblotting bands and urease activity. **** represents p values < 0.0001 and ** represents p values ≤ 0.005. Error bars represent standard deviation of three experimental replicates.
Figure 4
Figure 4
P. lutzii WT and AsFmd survival after macrophage infection. Following to recovering of ex vivo infection in murine J774 macrophages, CFU was counted at 7 days growth after the period of incubation. Shapiro–Wilk test was employed to determine data normality (p values > 0.2). Student’s t-test was performed on experimental triplicate from biological replicate data in order to understand the magnitude of existent differences between the CFU of the two groups. ** represents p values ≤ 0.005. Error bars represent standard deviation of two experimental replicates from biological duplicates.

References

    1. Turissini D.A., Gomez O.M., Teixeira M.M., McEwen J.G., Matute D.R. Species Boundaries in the Human Pathogen Paracoccidioides. Fungal Genet. Biol. 2017;106:9–25. doi: 10.1016/j.fgb.2017.05.007. - DOI - PMC - PubMed
    1. Vilela R., Huebner M., Vilela C., Vilela G., Pettersen B., Oliveira C., Mendoza L. The Taxonomy of Two Uncultivated Fungal Mammalian Pathogens Is Revealed through Phylogeny and Population Genetic Analyses. Sci. Rep. 2021;11:18119. doi: 10.1038/s41598-021-97429-7. - DOI - PMC - PubMed
    1. Martinez R. New Trends in Paracoccidioidomycosis Epidemiology. J. Fungi. 2017;3:1. doi: 10.3390/jof3010001. - DOI - PMC - PubMed
    1. Colombo A.L., Tobn A., Restrepo A., Queiroz-Telles F., Nucci M. Epidemiology of Endemic Systemic Fungal Infections in Latin America. Med. Mycol. 2011;49:785–798. doi: 10.3109/13693786.2011.577821. - DOI - PubMed
    1. Shikanai-Yasuda M.A., Mendes R.P., Colombo A.L., de Queiroz-Telles F., Kono A.S.G., Paniago A.M.M., Nathan A., do Valle A.C.F., Bagagli E., Benard G., et al. Brazilian Guidelines for the Clinical Management of Paracoccidioidomycosis. Rev. Soc. Bras. Med. Trop. 2017;50:715–740. doi: 10.1590/0037-8682-0230-2017. - DOI - PubMed

LinkOut - more resources