Review
. 2022 Oct 11;27(20):6795.
doi: 10.3390/molecules27206795.

Preprocessing NIR Spectra for Aquaphotomics

Affiliations
Review

Preprocessing NIR Spectra for Aquaphotomics

Jean-Michel Roger et al. Molecules. .

Abstract

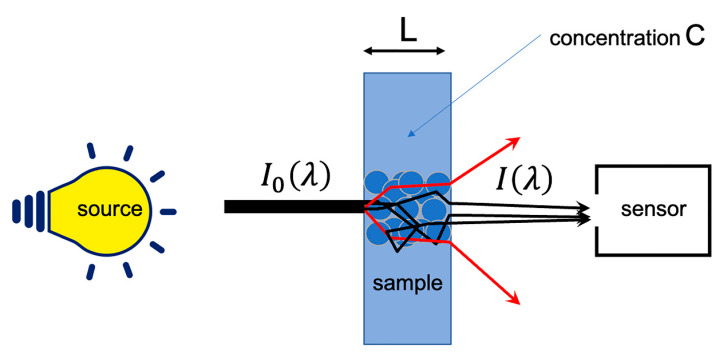
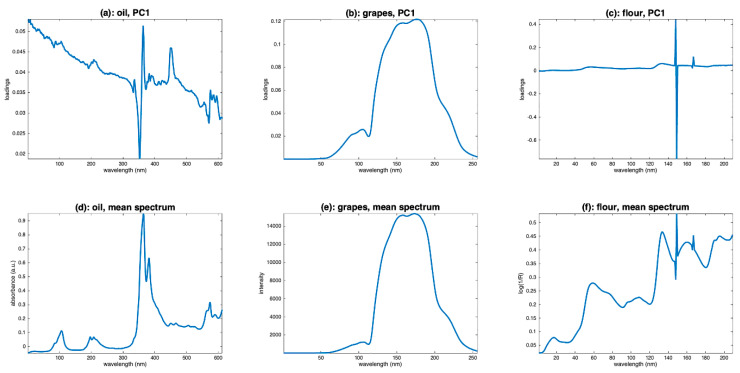
Even though NIR spectroscopy is based on the Beer-Lambert law, which clearly relates the concentration of the absorbing elements with the absorbance, the measured spectra are subject to spurious signals, such as additive and multiplicative effects. The use of NIR spectra, therefore, requires a preprocessing step. This article reviews the main preprocessing methods in the light of aquaphotomics. Simple methods for visualizing the spectra are proposed in order to guide the user in the choice of the best preprocessing. The most common chemometrics preprocessing are presented and illustrated by three real datasets. Some preprocessing aims to produce a spectrum as close as possible to the absorbance that would have been measured under ideal conditions and is very useful for the establishment of an aquagram. Others, dedicated to the improvement of the resolution of the spectra, are very useful for the identification of the peaks. Finally, special attention is given to the problem of reducing multiplicative effects and to the potential pitfalls of some very popular methods in chemometrics. Alternatives proposed in recent papers are presented.

Keywords: aquaphotomics; chemometrics; near infrared spectroscopy; preprocessing.


Conflict of interest statement

The authors declare no conflict of interest.

Figures

Figure 1
Figure 1
Ideal measurement of the absorption.
Figure 2
Figure 2
Real measurement of the absorption.
Figure 3
Figure 3
Spectra of olive oil (a), grapes (b) and flour (c).
Figure 4
Figure 4
Scatter plot of the spectra as a function of the mean spectrum for (a): oil data, (b): grape data, (c): flour data.
Figure 5
Figure 5
Scatter plot of the two first scores of a PCA calculated on (a): oil spectra, (b): grape spectra, (c): flour spectra.
Figure 6
Figure 6
Loadings of a PCA calculated on (a): oil spectra, (b): grape spectra, (c): flour spectra, and mean spectra of (d): oil, (e): grape and (f): flour.
Figure 7
Figure 7
Illustration of the phenomenon of alignment between the mean spectrum and the first axis of the PCA in the case of the presence of multiplicative effects.
Figure 8
Figure 8
Examples of flour spectra in the wavelength range 2245–2368 nm. (a): Raw spectra, (b): spectra smoothed by a moving window average, width 5, (c): spectra smoothed by a moving window average, width 11, (d): spectra smoothed by a moving polynomial fitting, degree 1, width 11, (d): spectra smoothed by a moving polynomial fitting, degree 1, width 11, (e): spectra smoothed by a moving polynomial fitting, degree 2, width 11, (f): spectra smoothed by a moving polynomial fitting, degree 5, width 11.
Figure 9
Figure 9
Illustration of the median filter on the first spectrum of the flour dataset. (a): Raw spectrum, (b): spectrum filtered by moving average, (c): spectrum filtered by moving median.
Figure 10
Figure 10
Illustration of the detrending preprocessing. (a,d,g): Oil spectra, (b,e,h): grape spectra, (c,f,i): flour spectra after median filtering (w = 3). (ac): Order 0, (df): order 1 and (gi): order 2.
Figure 11
Figure 11
Illustration of the calculation of 2nd order derivatives by the Savitzky and Golay Algorithm. (a): Oil, (b): grapes, (c): flour. All the derivatives have been calculated using an 11 point window and a degree 2 polynomial.
Figure 12
Figure 12
Illustration of asymmetric least squares filtering. (a): Oil, (b): grapes, (c): flour.
Figure 13
Figure 13
Illustration of normalization. (a,d): Oil, (b,e): grapes, (c,f): flour. (ac): Raw spectra are divided by their norm. (df): Raw spectra are first corrected by ALS and then divided by their norm.
Figure 14
Figure 14
Illustration of probabilistic quotient normalization. (a): Oil, (b): grapes, (c): flour.
Figure 15
Figure 15
Illustration of the detrimental effect of SNV. (a) Simulated pure spectra, (b): simulated spectra after addition of baselines and multiplicative factors, (c): result of SNV performed on the spectra in (b).
Figure 16
Figure 16
Illustration of the weighted SNV. (a): Spectra to be processed, (b): weights, (c): spectra after preprocessing by weighted SNV.
Figure 17
Figure 17
Illustration of the application of VSN. (a): VSN corrected oil spectra, (b): VSN corrected grape spectra, (c): VSN corrected flour spectra, (d): VSN weights for the oil spectra, (e): VSN weights for the grape spectra, (f): VSN weights for the flour spectra.

References

    1. Siesler H.W., Kawata S., Heise H.M., Ozaki Y., editors. Near-Infrared Spectroscopy: Principles, Instruments, Applications. John Wiley & Sons; Hoboken, NJ, USA: 2008.
    1. Pasquini C. Near infrared spectroscopy: A mature analytical technique with new perspectives–A review. Anal. Chim. Acta. 2018;1026:8–36. doi: 10.1016/j.aca.2018.04.004. - DOI - PubMed
    1. Tsenkova R. Visible-near infrared perturbation spectroscopy: Water in action seen as a source of information; Proceedings of the 12th International Conference on Near-Infrared Spectroscopy; Auckland, New Zealand. 1 September 2005; pp. 607–612.
    1. Muncan J., Tsenkova R. Aquaphotomics—From innovative knowledge to integrative platform in science and technology. Molecules. 2019;24:2742. doi: 10.3390/molecules24152742. - DOI - PMC - PubMed
    1. Martens H., Stark E. Extended multiplicative signal correction and spectral interference subtraction: New preprocessing methods for near infrared spectroscopy. J. Pharm. Biomed. Anal. 1991;9:625–635. doi: 10.1016/0731-7085(91)80188-F. - DOI - PubMed

MeSH terms

LinkOut - more resources