Review
. 2022 Oct 11;27(20):6797.
doi: 10.3390/molecules27206797.

Advances in Fungal Phenaloenones-Natural Metabolites with Great Promise: Biosynthesis, Bioactivities, and an In Silico Evaluation of Their Potential as Human Glucose Transporter 1 Inhibitors

Affiliations
Review

Advances in Fungal Phenaloenones-Natural Metabolites with Great Promise: Biosynthesis, Bioactivities, and an In Silico Evaluation of Their Potential as Human Glucose Transporter 1 Inhibitors

Sabrin R M Ibrahim et al. Molecules. .

Abstract

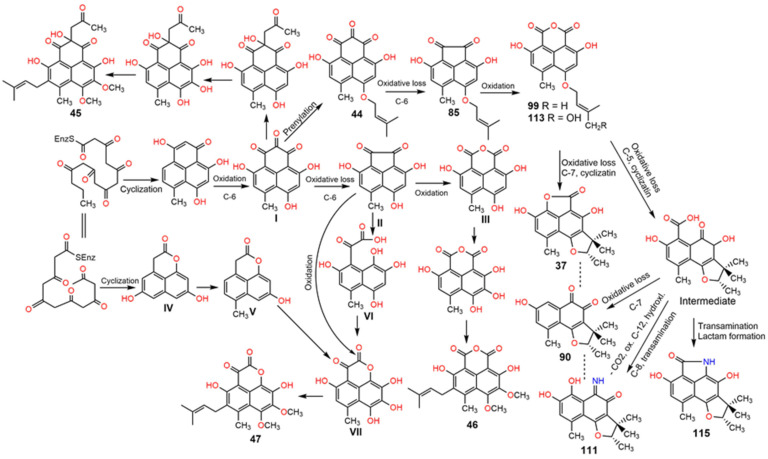
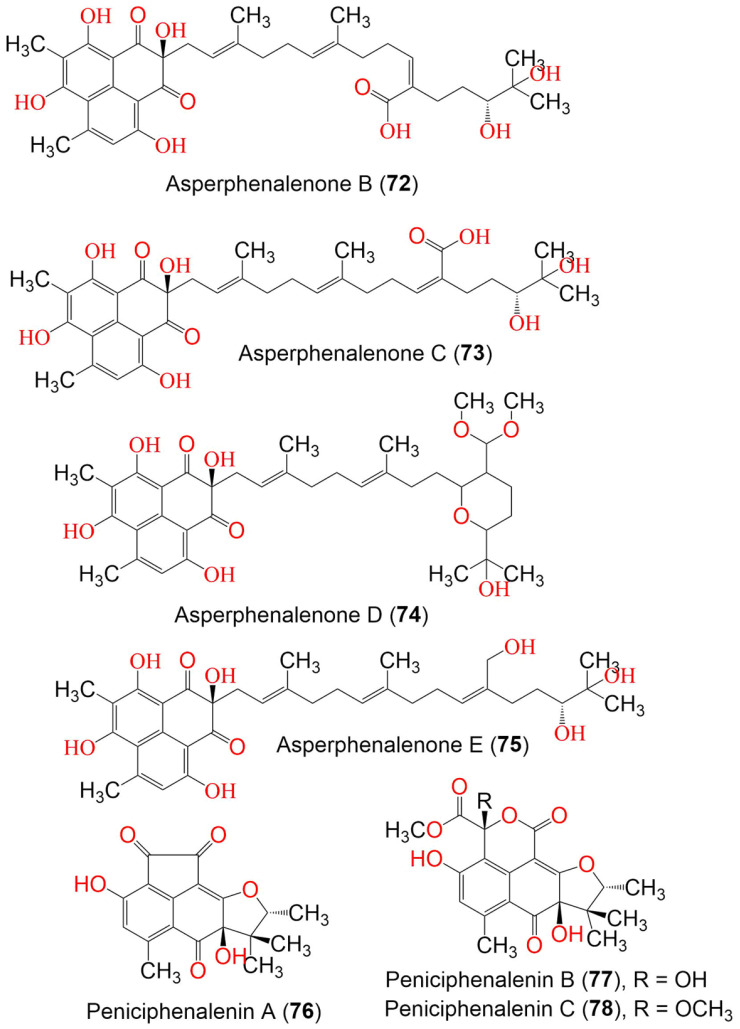
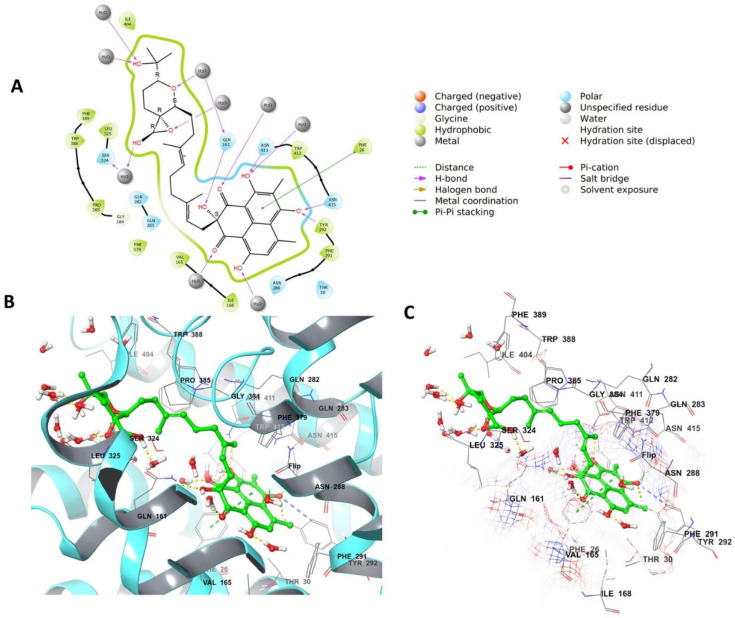
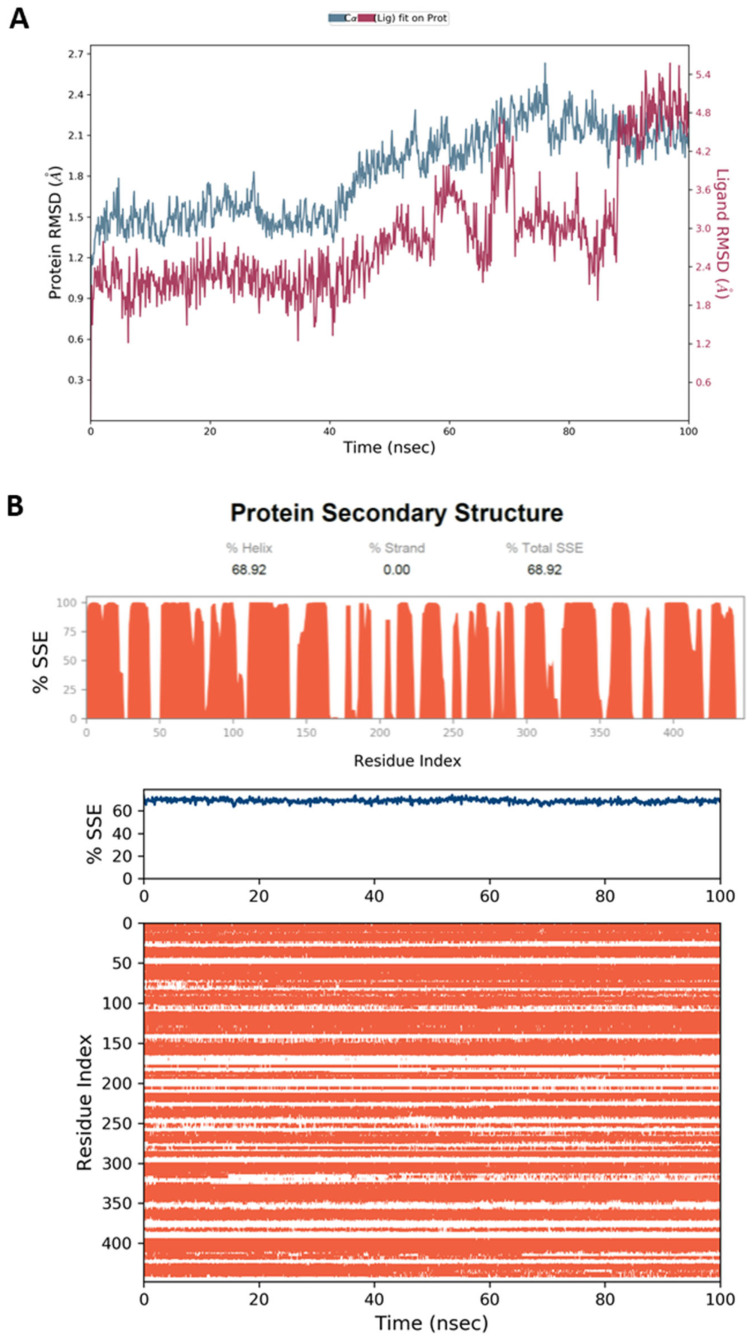
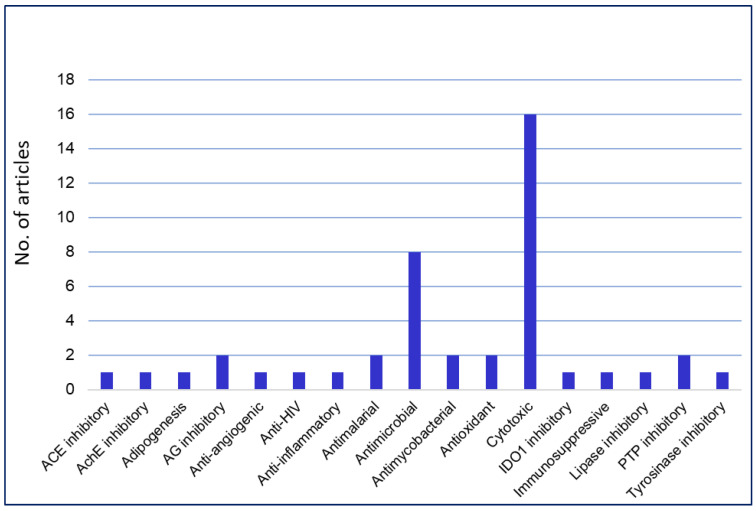
Phenaloenones are structurally unique aromatic polyketides that have been reported in both microbial and plant sources. They possess a hydroxy perinaphthenone three-fused-ring system and exhibit diverse bioactivities, such as cytotoxic, antimicrobial, antioxidant, and anti-HIV properties, and tyrosinase, α-glucosidase, lipase, AchE (acetylcholinesterase), indoleamine 2,3-dioxygenase 1, angiotensin-I-converting enzyme, and tyrosine phosphatase inhibition. Moreover, they have a rich nucleophilic nucleus that has inspired many chemists and biologists to synthesize more of these related derivatives. The current review provides an overview of the reported phenalenones with a fungal origin, including their structures, sources, biosynthesis, and bioactivities. Moreover, more than 135 metabolites have been listed, and 71 references have been cited. SuperPred, an artificial intelligence (AI) webserver, was used to predict the potential targets for selected phenalenones. Among these targets, we chose human glucose transporter 1 (hGLUT1) for an extensive in silico study, as it shows high probability and model accuracy. Among them, aspergillussanones C (60) and G (60) possessed the highest negative docking scores of -15.082 and -14.829 kcal/mol, respectively, compared to the native inhibitor of 5RE (score: -11.206 kcal/mol). The MD (molecular dynamics) simulation revealed their stability in complexes with GLUT1 at 100 ns. The virtual screening study results open up a new therapeutic approach by using some phenalenones as hGLUT1 inhibitors, which might be a potential target for cancer therapy.

Keywords: bioactivities; biosynthesis; fungi; human glucose transporter 1 (hGLUT1) inhibitors; in silico screening; molecular docking; molecular dynamics; phenaloenones.


Conflict of interest statement

The authors declare no conflict of interest.

Figures

Scheme 1
Scheme 1
Biosynthetic pathway of compounds 37, 4447, 85, 90, 99, 111, 113, and 115 [20,31].
Scheme 2
Scheme 2
Biosynthetic pathway of compounds 119 and 120 [21,56,62,63].
Scheme 3
Scheme 3
Proposed pathways for the formation of compounds 4954 [48].
Scheme 4
Scheme 4
Biosynthetic pathway of compounds 21, 28, 31, and 7681 [21,39,46].
Scheme 5
Scheme 5
Biosynthetic pathway of compounds 116–118 [55,66].
Figure 1
Figure 1
The structures of compounds 1–10.
Figure 2
Figure 2
The structures of compounds 11–22.
Figure 3
Figure 3
The structures of compounds 23–37.
Figure 4
Figure 4
The structures of compounds 3847.
Figure 5
Figure 5
The structures of compounds 48–57.
Figure 6
Figure 6
The structures of compounds 58–65.
Figure 7
Figure 7
The structures of compounds 66–71.
Figure 8
Figure 8
The structures of compounds 7278.
Figure 9
Figure 9
The structures of compounds 7386.
Figure 10
Figure 10
The structures of compounds 87102.
Figure 11
Figure 11
The structures of compounds 103115.
Figure 12
Figure 12
Structures of compounds 116123.
Figure 13
Figure 13
The structures of compounds 124132.
Figure 14
Figure 14
The structures of compounds 133139.
Figure 15
Figure 15
Docking validation by the re-docking of the native inhibitor into GLUT1 (PDB ID: 5EQG). (A) The interaction between the crystal structure 5EQG and the reference inhibitor 5RE in 2D view. (B) The binding interactions in 3D view, and (C) 3D interaction with mesh surface view.
Figure 16
Figure 16
GLUT1-60 complex after docking. (A) 2D view of the binding interactions between 60 complexed with GLUT1 (PDB: 5EQG). (B) 3D view of the binding interactions between 60 complexed with GLUT1 (PDB: 5EQG). (C) The 3D view of GLUT1-60 complex with the mesh surface view.
Figure 17
Figure 17
GLUT1-64 complex after docking. (A) 2D view of the binding interactions between compound 64 when complexed with GLUT1 (PDB: 5EQG). (B) 3D view of the binding interactions between compound 64 with the amino acids residues of GLUT1 within 3Å radius around the ligand (PDB: 5EQG). (C) The 3D view of the GLUT1-64 complex with the mesh surface indicating the electrostatic potential around the ligand.
Figure 18
Figure 18
(A) RMSD graph for the native inhibitor 5RE, complexed with the GLUT1 protein (PDB ID: 5EQG). The simulation time (100 ns) confirmed the stability of the complex, with no significant changes in the protein structure. (B) Stability of the secondary structure GLUT1 protein (PDB ID: 5EQG) throughout the MD simulation when complexed with 5RE. Protein secondary structure elements (SSE) were monitored during the simulation. The upper plot presented the SSE distribution by residue index across the protein structure. The middle plot summarized the SSE composition for each trajectory frame throughout the simulation, and the plot at the bottom monitored each residue and its SSE assignment over the simulation time.
Figure 19
Figure 19
(A) RMSD graph for compound 60 when complexed with the GLUT1 protein (PDB ID: 5EQG). The simulation time (100 ns) confirmed the stability of the complex, with no significant changes in the protein structure. (B) Stability of the secondary structure GLUT1 protein (PDB ID: 5EQG) throughout the MD simulation when complexed with 60. The protein secondary structure elements (SSE) were monitored during the simulation. The upper plot presents the SSE distribution according to residue index across the protein structure. The middle plot summarizes the SSE composition for each trajectory frame throughout the simulation, and the plot at the bottom monitors each residue and its SSE assignment over the simulation time.
Figure 20
Figure 20
(A) RMSD graph for compound 64 when complexed with the GLUT1 protein (PDB ID: 5EQG). The simulation time (100 ns) confirmed the stability of the complex, with no significant changes in the protein structure. (B) Stability of the secondary structure of the GLUT1 protein (PDB ID: 5EQG) throughout the MD simulation when complexed with 64. The protein secondary structure elements (SSE) were monitored during the simulation. The upper plot presents SSE distribution by residue index across the protein structure. The middle plot summarizes the SSE composition for each trajectory frame throughout the simulation, and the plot at the bottom monitors each residue and its SSE assignment over the simulation time.
Figure 21
Figure 21
(A) The interaction of GLUT1 (PDB: 5EQG) with the native inhibitor 5RE throughout the simulation. The interactions between the ligand and protein were classified into hydrophobic, hydrogen bond, ionic, and water bridge interactions. The stacked bar charts were normalized over the course of the trajectory: for example, a value of 0.65 suggested that the interaction with the specific amino acid residue was maintained during 65% of the simulation time. Values over 1.0 imply that some protein residue made multiple interactions of the same subtype with the ligand. (B) A schematic diagram showed the detailed 2D atomic interactions of 5RE with GLUT1, occurring for > 30% of the simulation time in the selected trajectory (0 through 100 ns). Interactions with > 100% occurrence meant that those residues may have multiple interactions of a single type with the same ligand atom. (C) A timeline representation of the GLUT1-5RE interactions shown in (A). The panel at the top illustrates the total number of specific interactions that the protein has made with the compound over the course of the trajectory. The panel below illustrates which residues interacted with the ligand in each trajectory frame. The dark or orange color indicated that more than one specific interaction was seen between certain residues and the ligand. # Number of contacts.
Figure 22
Figure 22
(A) The interaction of GLUT1 (PDB: 5EQG) with the native inhibitor 60 throughout the simulation. The interactions between the ligand and protein were classified into hydrophobic, hydrogen bond, ionic, and water bridge interactions. The stacked bar charts were normalized over the course of the trajectory: for example, a value of 0.65 suggested that the interaction with the specific amino acid residue was maintained during 65% of the simulation time. Values over 1.0 implied that some protein residues made multiple interactions of the same subtype with the ligand. (B) A schematic diagram showing the detailed 2D atomic interactions of 60 with GLUT1, occurring for > 30% of the simulation time in the selected trajectory (0 through 100 ns). Interactions with > 100% occurrence meant that residues may have multiple interactions of a single type with the same ligand atom. (C) A timeline representation of the GLUT1-60 interactions shown in (A). The panel on top illustrates the total number of specific interactions that the protein has made with the compound over the course of the trajectory. The panel below illustrates which residues interacted with the ligand in each trajectory frame. The dark or orange color indicates that more than one specific interaction was made between some residues and the ligand.
Figure 23
Figure 23
(A) The interaction of GLUT1 (PDB: 5EQG) with the native inhibitor 64 throughout the simulation. The interactions between the ligand and protein were classified into hydrophobic, hydrogen bond, ionic, and water bridge interactions. The stacked bar charts were normalized over the course of the trajectory: for example, a value of 0.65 suggested that the interaction with the specific amino acid residue was maintained during 65% of the simulation time. Values over 1.0 implied that some protein residues made multiple interactions of the same subtype with the ligand. (B) Schematic diagram showing the detailed 2D atomic interactions of 64 with GLUT1, occurring > 30% of the simulation time in the selected trajectory (0 through 100 ns). Interactions with >100% occurrence meant that residues may have multiple interactions of a single type with the same ligand atom. (C) A timeline representation of the GLUT1-64 interactions shown in (A). The panel on top illustrated the total number of specific interactions the protein made with the compound over the course of the trajectory. The panel below illustrates which residues interacted with the ligand in each trajectory frame. The dark or orange color indicates that more than one specific interaction was made between some residues and the ligand.
Figure 24
Figure 24
The numbers of phenalenones isolated from the different fungal genera.
Figure 25
Figure 25
Biological activities of isolated phenalenones and the number of articles.

References

    1. Ibrahim S.R.M., Altyar A.E., Mohamed S.G.A., Mohamed G.A. Genus Thielavia: Phytochemicals, industrial importance and biological relevance. Nat. Prod. Res. 2021;36:5108–5123. doi: 10.1080/14786419.2021.1919105. - DOI - PubMed
    1. Ibrahim S.R.M., Mohamed S.G.A., Altyar A.E., Mohamed G.A. Natural products of the fungal genus Humicola: Diversity, biological activity, and industrial importance. Curr. Microbiol. 2021;78:2488–2509. doi: 10.1007/s00284-021-02533-6. - DOI - PubMed
    1. Ibrahim S.R.M., Mohamed S.G.A., Sindi I.A., Mohamed G.A. Biologically active secondary metabolites and biotechnological applications of species of the family Chaetomiaceae (Sordariales): An updated review from 2016 to 2021. Mycol. Prog. 2021;20:595–639. doi: 10.1007/s11557-021-01704-w. - DOI
    1. Ibrahim S.R.M., Sirwi A., Eid B.G., Mohamed S.G.A., Mohamed G.A. Bright Side of Fusarium oxysporum: Secondary Metabolites Bioactivities and Industrial Relevance in Biotechnology and Nanotechnology. J. Fungi. 2021;7:943. doi: 10.3390/jof7110943. - DOI - PMC - PubMed
    1. Ibrahim S., Sirwi A., Eid B.G., Mohamed S., Mohamed G.A. Fungal Depsides-Naturally Inspiring Molecules: Biosynthesis, Structural Characterization, and Biological Activities. Metabolites. 2021;11:683. doi: 10.3390/metabo11100683. - DOI - PMC - PubMed