

Highly Sensitive Electrochemical Detection of Paraquat in Environmental Water Samples Using a Vertically Ordered Mesoporous Silica Film and a Nanocarbon Composite
- PMID: 36296822
- PMCID: PMC9610481
- DOI: 10.3390/nano12203632
Highly Sensitive Electrochemical Detection of Paraquat in Environmental Water Samples Using a Vertically Ordered Mesoporous Silica Film and a Nanocarbon Composite
Abstract
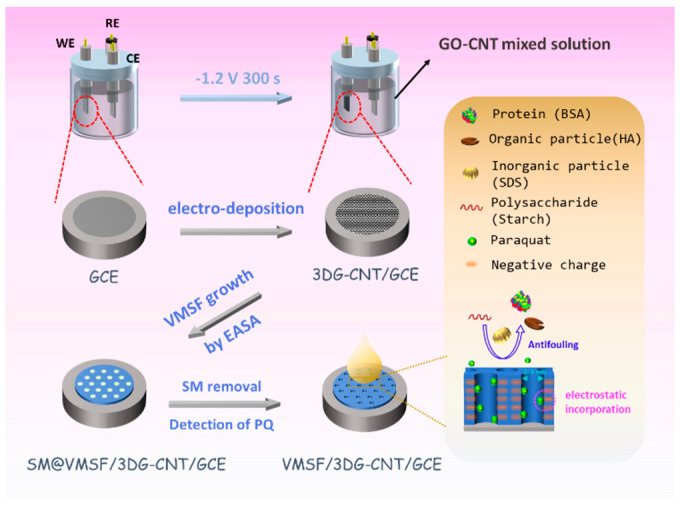
Herein, we demonstrate a sensitive and rapid electrochemical method for the detection of paraquat (PQ) using a glassy carbon electrode (GCE) modified with vertically ordered mesoporous silica films (VMSF) and a nanocarbon composite. The three-dimensional graphene-carbon nanotube (3DG-CNT) nanocarbon composite has a 3D network structure, a large electroactive area and oxygen-containing groups, promoting electron transfer between PQ and the underlying electrode and providing a suitable microenvironment for the stable growth of VMSF. This VMSF/3DG-CNT nanocomposite film could be prepared on the GCE's surface by a two-step electrochemical method with good controllability and convenience. Owing to the synergistic effect of the electrocatalytic ability of 3DG-CNT and the electrostatically enriched capacity of VMSF, the proposed VMSF/3DG-CNT/GCE has superior analytical sensitivity compared with the bare GCE. Furthermore, VMSF has excellent anti-fouling ability that makes the fabricated sensor exhibit satisfactory performance for direct analysis of PQ in environmental water samples.
Keywords: carbon nanotubes; electrochemical detection; electrochemically reduced graphene oxide; paraquat; vertically ordered mesoporous silica films.
Conflict of interest statement
The authors declare no conflict of interest.
Figures


Similar articles
-
Equipment of Vertically-Ordered Mesoporous Silica Film on Electrochemically Pretreated Three-Dimensional Graphene Electrodes for Sensitive Detection of Methidazine in Urine.Nanomaterials (Basel). 2023 Jan 5;13(2):239. doi: 10.3390/nano13020239. Nanomaterials (Basel). 2023. PMID: 36677991 Free PMC article.
-
Vertically-Ordered Mesoporous Silica Films Grown on Boron Nitride-Graphene Composite Modified Electrodes for Rapid and Sensitive Detection of Carbendazim in Real Samples.Front Chem. 2022 Jul 12;10:939510. doi: 10.3389/fchem.2022.939510. eCollection 2022. Front Chem. 2022. PMID: 35903187 Free PMC article.
-
Integration of vertically-ordered mesoporous silica-nanochannel film with electro-activated glassy carbon electrode for improved electroanalysis in complex samples.Talanta. 2021 Apr 1;225:122066. doi: 10.1016/j.talanta.2020.122066. Epub 2020 Dec 29. Talanta. 2021. PMID: 33592785
-
Electrochemical/Electrochemiluminescence Sensors Based on Vertically-Ordered Mesoporous Silica Films for Biomedical Analytical Applications.Chembiochem. 2024 Nov 4;25(21):e202400320. doi: 10.1002/cbic.202400320. Epub 2024 Aug 2. Chembiochem. 2024. PMID: 38874487 Review.
-
Composite Silica-Based Films as Platforms for Electrochemical Sensors.Chem Rec. 2024 Feb;24(2):e202300194. doi: 10.1002/tcr.202300194. Epub 2023 Sep 22. Chem Rec. 2024. PMID: 37737456 Review.
Cited by
-
Dual-Mode Sensing Platform for Cancer Antigen 15-3 Determination Based on a Silica Nanochannel Array Using Electrochemiluminescence and Electrochemistry.Biosensors (Basel). 2023 Feb 24;13(3):317. doi: 10.3390/bios13030317. Biosensors (Basel). 2023. PMID: 36979529 Free PMC article.
-
Solid Electrochemiluminescence Sensor by Immobilization of Emitter Ruthenium(II)tris(bipyridine) in Bipolar Silica Nanochannel Film for Sensitive Detection of Oxalate in Serum and Urine.Nanomaterials (Basel). 2024 Feb 20;14(5):390. doi: 10.3390/nano14050390. Nanomaterials (Basel). 2024. PMID: 38470721 Free PMC article.
-
Sensitive Detection of Biomarker in Gingival Crevicular Fluid Based on Enhanced Electrochemiluminescence by Nanochannel-Confined Co3O4 Nanocatalyst.Biosensors (Basel). 2025 Jan 19;15(1):63. doi: 10.3390/bios15010063. Biosensors (Basel). 2025. PMID: 39852114 Free PMC article.
-
Electrochemiluminescence Aptasensor with Dual Signal Amplification by Silica Nanochannel-Based Confinement Effect on Nanocatalyst and Efficient Emitter Enrichment for Highly Sensitive Detection of C-Reactive Protein.Molecules. 2023 Nov 19;28(22):7664. doi: 10.3390/molecules28227664. Molecules. 2023. PMID: 38005386 Free PMC article.
-
Equipment of Vertically-Ordered Mesoporous Silica Film on Electrochemically Pretreated Three-Dimensional Graphene Electrodes for Sensitive Detection of Methidazine in Urine.Nanomaterials (Basel). 2023 Jan 5;13(2):239. doi: 10.3390/nano13020239. Nanomaterials (Basel). 2023. PMID: 36677991 Free PMC article.
References
-
- Chuntib P., Themsirimongkon S., Saipanya S., Jakmunee J. Sequential injection differential pulse voltammetric method based on screen printed carbon electrode modified with carbon nanotube/Nafion for sensitive determination of paraquat. Talanta. 2017;170:1–8. doi: 10.1016/j.talanta.2017.03.073. - DOI - PubMed
-
- De Figueiredo-Filho L.C.S., Baccarin M., Janegitz B.C., Fatibello-Filho O. A disposable and inexpensive bismuth film minisensor for a voltammetric determination of diquat and paraquat pesticides in natural water samples. Sens. Actuators B Chem. 2017;240:749–756. doi: 10.1016/j.snb.2016.08.157. - DOI
-
- Valera E., García-Febrero R., Pividori I., Sánchez-Baeza F., Marco M.P. Coulombimetric immunosensor for paraquat based on electrochemical nanoprobes. Sens. Actuators B Chem. 2014;194:353–360. doi: 10.1016/j.snb.2013.12.029. - DOI
Grants and funding
LinkOut - more resources
Full Text Sources
