. 2022 Sep 28;15(10):1204.
doi: 10.3390/ph15101204.

Caulis Polygoni Multiflori Accelerates Megakaryopoiesis and Thrombopoiesis via Activating PI3K/Akt and MEK/ERK Signaling Pathways

Affiliations

Caulis Polygoni Multiflori Accelerates Megakaryopoiesis and Thrombopoiesis via Activating PI3K/Akt and MEK/ERK Signaling Pathways

Xin Yang et al. Pharmaceuticals (Basel). .

Abstract

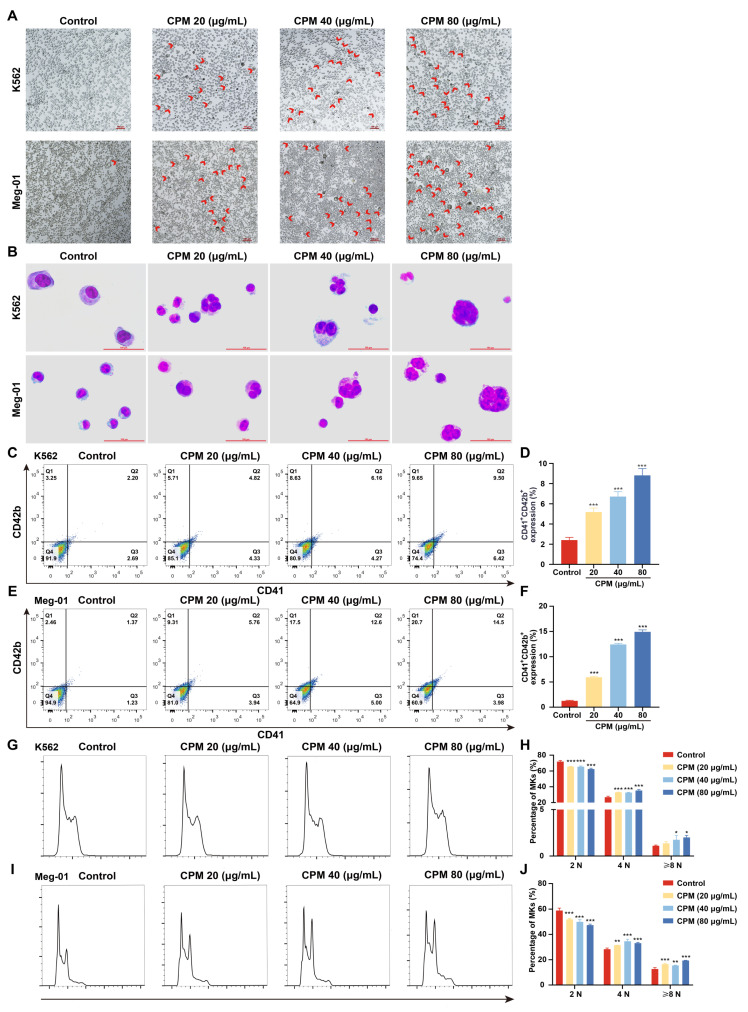
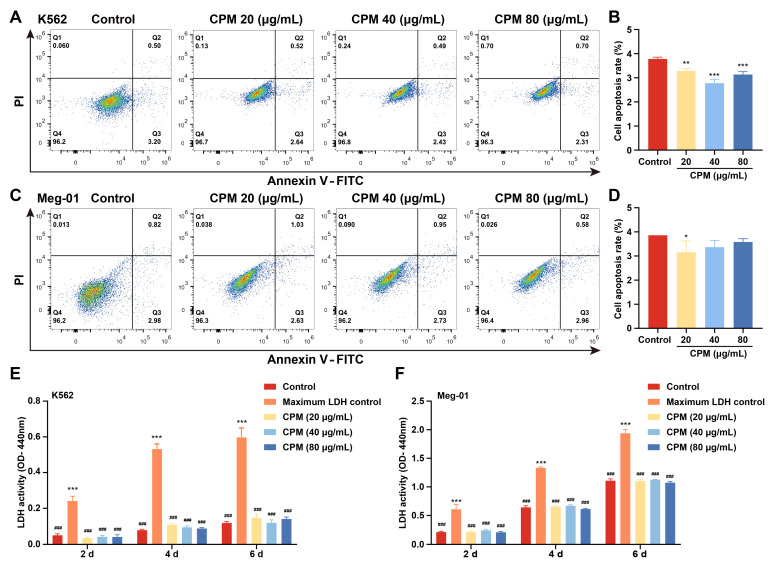
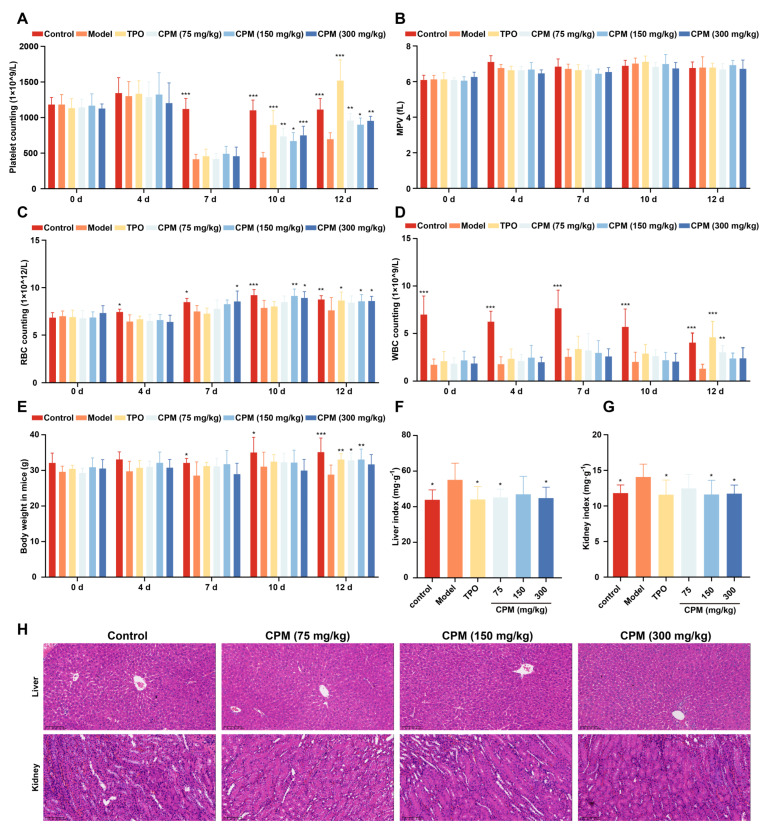
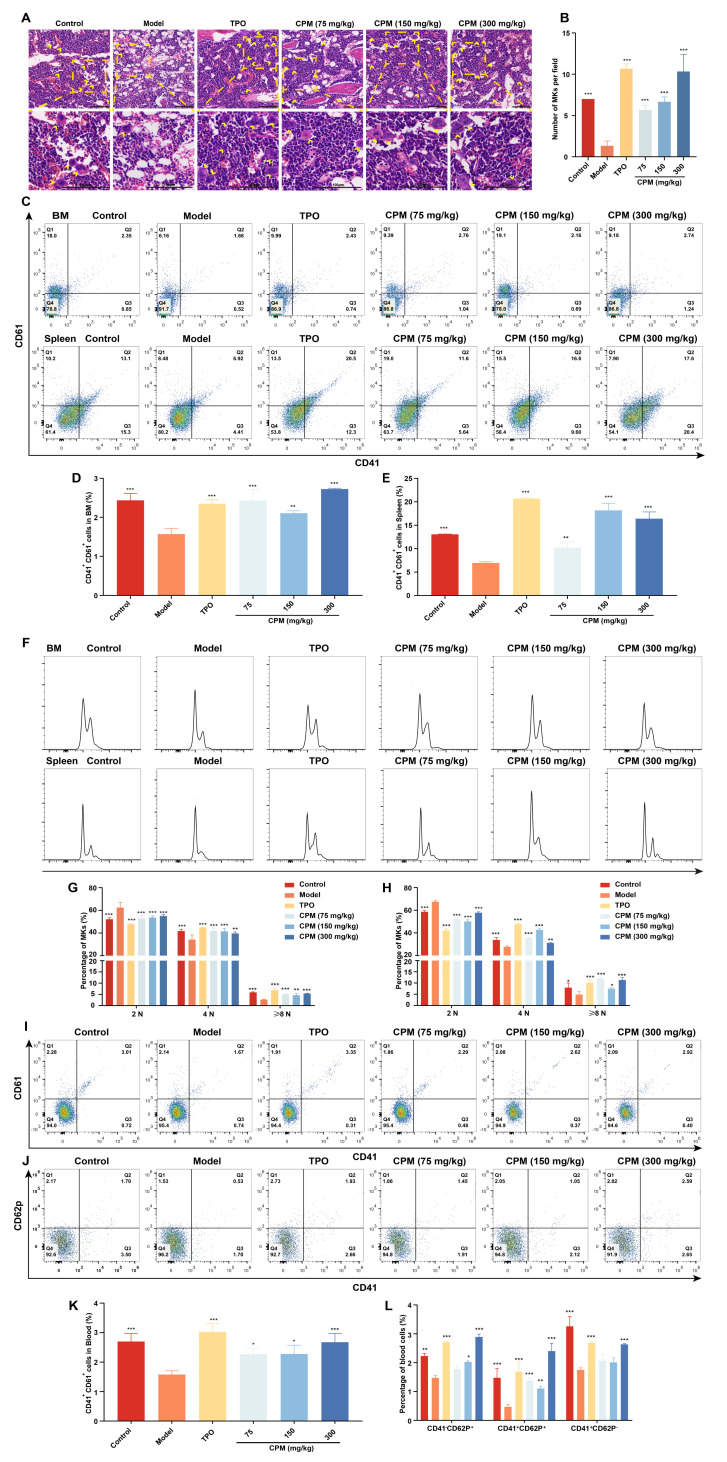
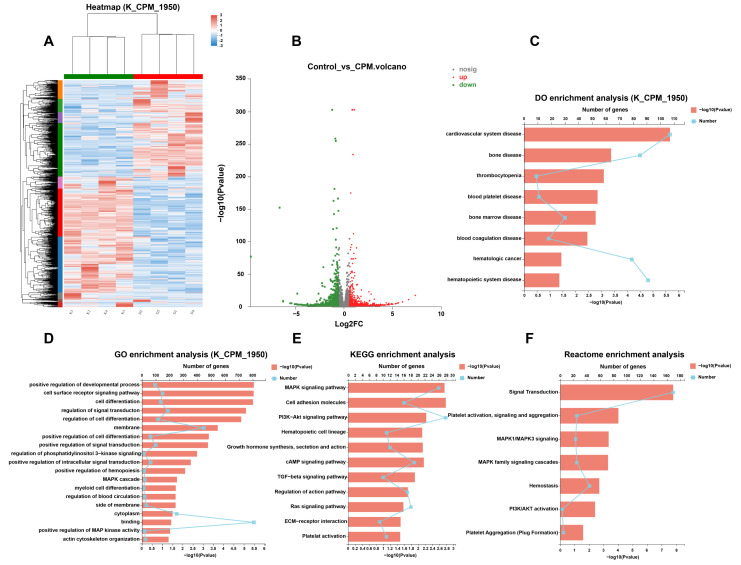
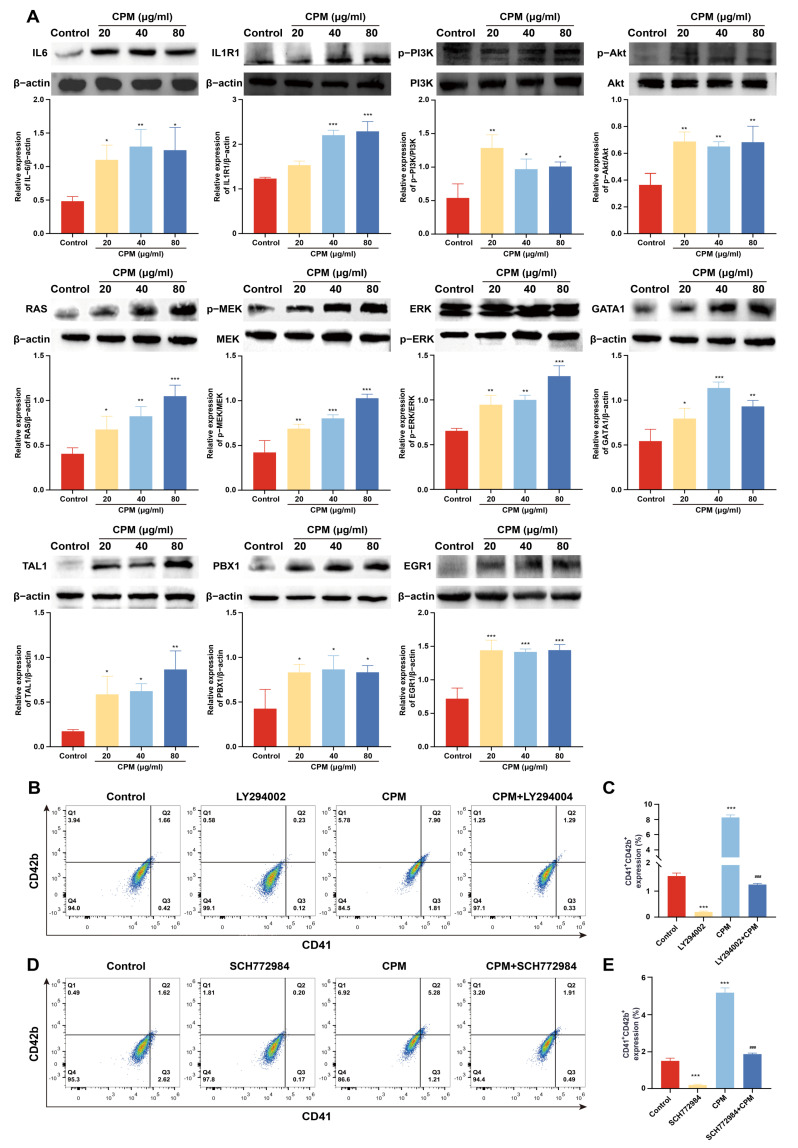
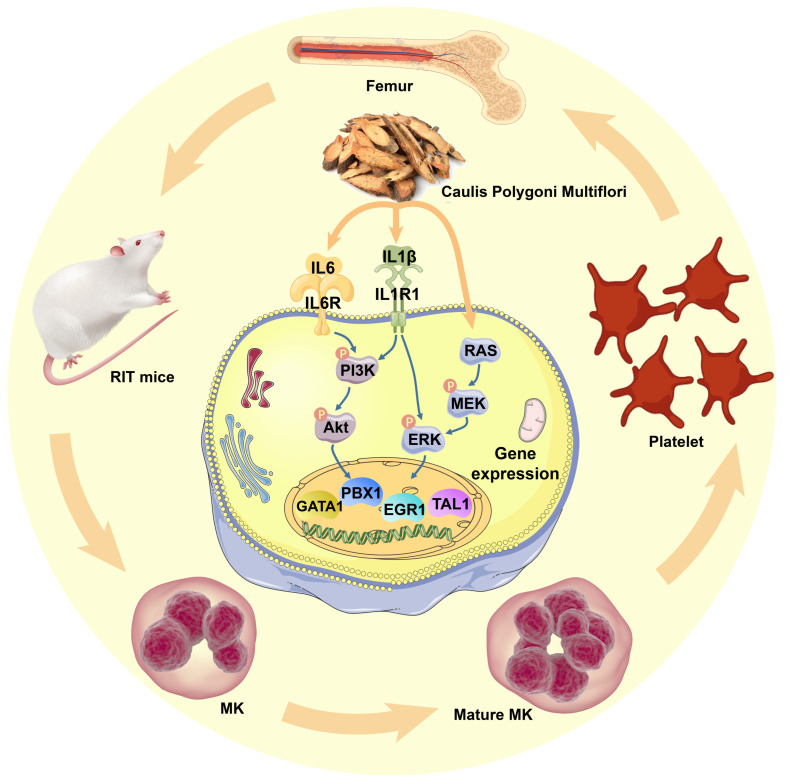
Thrombocytopenia is one of the most common complications of cancer therapy. Until now, there are still no satisfactory medications to treat chemotherapy and radiation-induced thrombocytopenia (CIT and RIT, respectively). Caulis Polygoni Multiflori (CPM), one of the most commonly used Chinese herbs, has been well documented to nourish blood for tranquilizing the mind and treating anemia, suggesting its beneficial effect on hematopoiesis. However, it is unknown whether CPM can accelerate megakaryopoiesis and thrombopoiesis. Here, we employ a UHPLC Q-Exactive HF-X mass spectrometer (UHPLC QE HF-X MS) to identify 11 ingredients in CPM. Then, in vitro experiments showed that CPM significantly increased megakaryocyte (MK) differentiation and maturation but did not affect apoptosis and lactate dehydrogenase (LDH) release of K562 and Meg-01 cells. More importantly, animal experiments verified that CPM treatment markedly accelerated platelet recovery, megakaryopoiesis and thrombopoiesis in RIT mice without hepatic and renal toxicities in vivo. Finally, RNA-sequencing (RNA-seq) and western blot were used to determine that CPM increased the expression of proteins related to PI3K/Akt and MEK/ERK (MAPK) signaling pathways. On the contrary, blocking PI3K/Akt and MEK/ERK signaling pathways with their specific inhibitors suppressed MK differentiation induced by CPM. In conclusion, for the first time, our study demonstrates that CPM may be a promised thrombopoietic agent and provide an experimental basis for expanding clinical use.

Keywords: Caulis Polygoni Multiflori; MEK/ERK; PI3K/Akt; megakaryopoiesis; thrombocytopenia; thrombopoiesis.


Conflict of interest statement

The authors declare no conflict of interest.

Figures

Figure 1
Figure 1
CPM induces MK differentiation. (A) Microscope photographs of K562 and Meg-01 cells with or without CPM (20, 40 and 80 µg/mL) treatment for 5 days. Scar bar: 100 µm. Microscopy fields were captured randomly at 10× resolution. (B) Giemsa staining of K562 and Meg-01 cells with or without CPM (20, 40 and 80 µg/mL) treatment for 5 days. Scar bar: 100 µm. (C,E) CD41 and CD42b expression of K562 and Meg-01 cells with or without CPM (20, 40 and 80 µg/mL) treatment for 5 days. (D,F) The proportion of CD41+CD42b+ cells in control and CPM-treated groups. Data are mean ± SD (n = 3). (G,I) DNA ploidy analysis of K562 and Meg-01 cells with or without CPM (20, 40 and 80 µg/mL) treatment for 5 days. (H,J) The percentage of 2 N, 4 N and ≥ 8 N cells in each group. Data are mean ± SD (n = 3, ANOVA). * p < 0.05, ** p < 0.01, *** p < 0.001 vs. the control group.
Figure 2
Figure 2
Cytotoxicity of CPM. (A,C) Apoptosis analysis in K562 and Meg-01 cells after treatment with or without CPM (20, 40 and 80 µg/mL) for 5 days. Q2 (Annexin+ PI+) denotes late apoptotic. Q3 (Annexin+ PI) denotes early apoptotic cells. (B,D) Q2 + Q3 represents total apoptotic cells. Statistical analysis of apoptotic cells (Q2 + Q3) of K562 and Meg-01 cells in each group. Data are means ± SD (n = 3). (E,F) Detection of LDH activity of K562 and Meg-01 cells after treatment with or without CPM (20, 40 and 80 µg/mL) for 2, 4 and 6 days. Maximum LDH control represents the total amount of LDH present in the cells. Data are mean ± SD (n = 3, ANOVA). * p < 0.05, ** p < 0.01, *** p < 0.001 vs. the control group. ### p < 0.001 vs. the maximum LDH control.
Figure 3
Figure 3
The therapeutic effects of CPM on RIT mice. The KM mice aged 6–8 weeks were irradiated and then administrated with normal saline, TPO (3000 U/kg), or CPM (75, 150 and 300 mg/kg) solubilized in normal saline for 12 days, respectively. Each group included 8 randomly assigned mice (4 male mice and 4 female mice). Routine blood examination was conducted on days 0, 4, 7, 10 and 12. (A) Platelet counts in each group. Data are mean ± SD (n = 8). (B) MPV in each group. Data are mean ± SD (n = 8). (C) RBC counts in each group. Data are mean ± SD (n = 8). (D) WBC counts in each group. Data are mean ± SD (n = 8). (E) Body weight in each group. Data are mean ± SD (n = 8). (F) Liver index in each group on day 12. Data are mean ± SD (n = 8). (G) Kidney index in each group on day 12. Data are mean ± SD (n = 8, ANOVA). * p < 0.05, ** p < 0.01, *** p < 0.001 vs. the model group. (H) H&E staining of the liver and kidney in each group on day 12. Bars: 200 µm.
Figure 4
Figure 4
CPM promotes MK differentiation, maturation and platelet activation in RIT mice. (A) H&E staining of BM in control, model, TPO and CPM-treated groups on day 10. Bars: 100 µm. The MKs are indicated by arrows. (B) The MK counts of each group in BM. Data are mean ± SD (n = 3). (C) CD41 and CD61 expression in BM and spleen cells of each group on day 12. (D,E) The percentage of CD41+CD61+ cells in BM and spleen, respectively. Data are mean ± SD (n = 3). (F) Ploidy analysis of the BM and spleen cells. (G,H) The percentage of 2 N, 4 N and ≥ 8 N cells of BM and spleen in each group. Data are mean ± SD (n = 3). (I) The expression of CD41 and CD61 in PB of each group after treatment for 12 days. (J) The expression of CD41 and CD62p in PB of each group after administration for 12 days. (K) The proportion of CD41+CD61+ cells of PB in each group. Data are mean ± SD (n = 3). (L) The proportion of CD41CD62P+, CD41+CD62P+ and CD41+CD62P cells in each group. Data are mean ± SD (n = 3, ANOVA). * p < 0.05, **p < 0.01, *** p < 0.001 vs. the model group.
Figure 5
Figure 5
RNA-seq analysis of the gene expression profile modulated by CPM. (A) Hierarchical clustering analysis indicates the change in gene expression between the control and CPM-treated groups. (B) Volcano plot representing the DEGs regulated by CPM. (C) DO enrichment analysis. (D) GO enrichment analysis. (E) KEGG pathway enrichment analysis. (F) Reactome pathway enrichment analysis.
Figure 6
Figure 6
CPM induces MK differentiation through activating PI3K/Akt and MEK/ERK signaling pathways. (A) The measurement of proteins belonging to PI3K/Akt and MEK/ERK signaling pathways and hematopoietic TFs by western blot in control and CPM (20, 40 and 80 µg/mL)-treated groups on K562 cells. The data are the mean ± SD (n = 3). * p <0.05, ** p <0.01, *** p < 0.001 vs. the control group. (B) Detection of CD41 and CD42b expression in K562 cells after treatment with CPM (80 µg/mL), CPM (80 µg/mL) + LY294002 (20 µM), and LY294002 (20 µM) for 5 days. (C) The proportion of CD41+CD42b+ cells in each group. Data are mean ± SD (n = 3). *** p < 0.001 vs. the control group. ### p < 0.001 vs. CPM group. (D) Detection of CD41 and CD42b expression on K562 cells after CPM (80 µg/mL), CPM (80 µg/mL) + SCH772984 (3 µM), and SCH772984 (3 µM) treatments for 5 days. (E) The percentage of CD41+CD42b+ cells in each group. Data are mean ± SD (n = 3, ANOVA). *** p < 0.001 vs. the control group. ### p < 0.001 vs. the CPM group.
Figure 7
Figure 7
Schematic model for CPM action in regulating megakaryopoiesis and thrombopoiesis. CPM induces IL-6 and IL1R1 expressions, causing the activation of PI3K/Akt and MEK/ERK (MAPK) signaling pathways, followed by the activation of downstream hematopoietic TFs, including GATA1, TAL1, PBX1 and EGR1, which stimulate MK differentiation and platelet production.

Similar articles

Cited by

References

    1. Soerjomataram I., Bray F. Planning for tomorrow: Global cancer incidence and the role of prevention 2020–2070. Nat. Rev. Clin. Oncol. 2021;18:663–672. doi: 10.1038/s41571-021-00514-z. - DOI - PubMed
    1. Sung H., Ferlay J., Siegel R.L., Laversanne M., Soerjomataram I., Jemal A., Bray F. Global Cancer Statistics 2020: GLOBOCAN estimates of incidence and mortality worldwide for 36 cancers in 185 countries. CA A Cancer J. Clin. 2021;71:209–249. doi: 10.3322/caac.21660. - DOI - PubMed
    1. Baskar R., Lee K.A., Yeo R., Yeoh K.W. Cancer and radiation therapy: Current advances and future directions. Int. J. Med. Sci. 2012;9:193–199. doi: 10.7150/ijms.3635. - DOI - PMC - PubMed
    1. Schaue D., McBride W.H. Opportunities and challenges of radiotherapy for treating cancer. Nat. Rev. Clin. Oncol. 2015;12:527–540. doi: 10.1038/nrclinonc.2015.120. - DOI - PMC - PubMed
    1. Razzaghdoust A., Mofid B., Zangeneh M. Predicting chemotherapy-induced thrombocytopenia in cancer patients with solid tumors or lymphoma. J. Oncol. Pharm. Pract. Off. Publ. Int. Soc. Oncol. Pharm. Pract. 2020;26:587–594. doi: 10.1177/1078155219861423. - DOI - PubMed