

Evolutionary Aspects of Hypericin Productivity and Endogenous Phytohormone Pools Evidenced in Hypericum Species In Vitro Culture Model
- PMID: 36297777
- PMCID: PMC9609395
- DOI: 10.3390/plants11202753
Evolutionary Aspects of Hypericin Productivity and Endogenous Phytohormone Pools Evidenced in Hypericum Species In Vitro Culture Model
Abstract
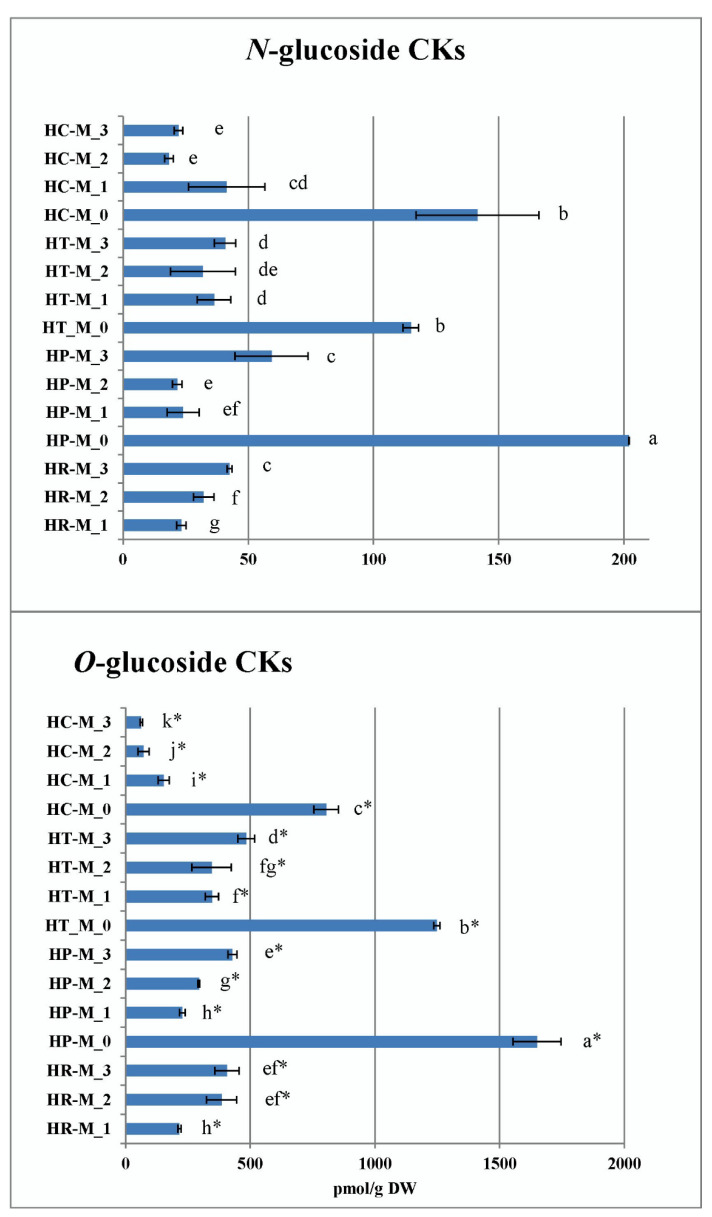
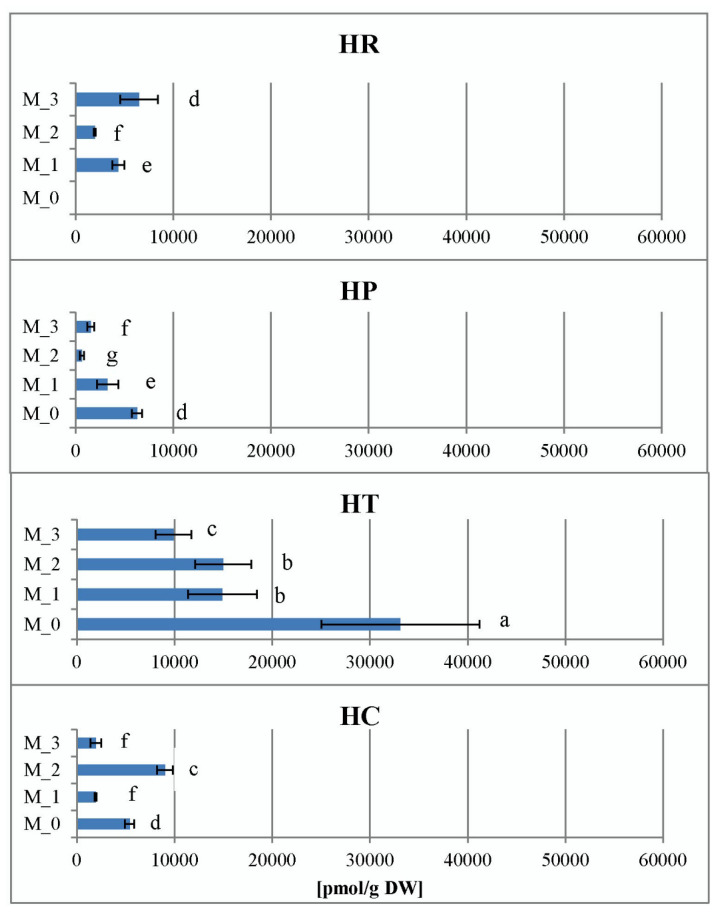
Shoot cultures of hypericin non-producing H. calycinum L. (primitive Ascyreia section), hypericin-producing H. perforatum L., H. tetrapterum Fries (section Hypericum) and H. richeri Vill. (the evolutionarily most advanced section Drosocarpium in our study) were developed and investigated for their growth, development, hypericin content and endogenous phytohormone levels. Hypericins in wild-growing H. richeri significantly exceeded those in H. perforatum and H. tetrapterum. H. richeri also had the highest hypericin productivity in vitro in medium supplemented with 0.2 mg/L N6-benzyladenine and 0.1 mg/L indole-3-butyric acid and H. tetrapterum-the lowest one in all media modifications. In shoot culture conditions, the evolutionarily oldest H. calycinum had the highest content of salicylic acid and total jasmonates in some of its treatments, as well as dominance of the storage form of abscisic acid (ABA-glucose ester) and lowest cytokinin ribosides and cytokinin O-glucosides as compared with the other three species. In addition, the evolutionarily youngest H. richeri was characterized by the highest total amount of cytokinin ribosides. Thus, both evolutionary development and the hypericin production capacity seemed to interact closely with the physiological parameters of the plant organism, such as endogenous phytohormones, leading to the possible hypothesis that hypericin productivity may have arisen in the evolution of Hypericum as a means to adapt to environmental changes.
Keywords: Hypericum evolution; endogenous phytohormones; hypericin; in vitro culture; wild habitats.
Conflict of interest statement
The authors declare no conflict of interest.
Figures


Similar articles
-
Identification and quantification of hypericin and pseudohypericin in different Hypericum perforatum L. in vitro cultures.Plant Physiol Biochem. 2005 Jun;43(6):591-601. doi: 10.1016/j.plaphy.2005.05.005. Plant Physiol Biochem. 2005. PMID: 15979315
-
Shoot Tip Meristem Cryopreservation of Hypericum Species.Methods Mol Biol. 2016;1391:31-46. doi: 10.1007/978-1-4939-3332-7_3. Methods Mol Biol. 2016. PMID: 27108308
-
Hypericin and pseudohypericin in some Hypericum species.Biochem Syst Ecol. 2001 Feb 1;29(2):171-178. doi: 10.1016/s0305-1978(00)00032-6. Biochem Syst Ecol. 2001. PMID: 11106845
-
Do other Hypericum species have medical potential as St. John's wort (Hypericum perforatum)?Curr Med Chem. 2013;20(18):2273-95. doi: 10.2174/0929867311320180001. Curr Med Chem. 2013. PMID: 23521674 Review.
-
Hypericins: biotechnological production from cell and organ cultures.Appl Microbiol Biotechnol. 2014 Nov;98(22):9187-98. doi: 10.1007/s00253-014-6119-3. Epub 2014 Oct 10. Appl Microbiol Biotechnol. 2014. PMID: 25301586 Review.
Cited by
-
Antioxidant Capacity and Accumulation of Caffeoylquinic Acids in Arnica montana L. In Vitro Shoots After Elicitation with Yeast Extract or Salicylic Acid.Plants (Basel). 2025 Mar 19;14(6):967. doi: 10.3390/plants14060967. Plants (Basel). 2025. PMID: 40265909 Free PMC article.
-
Plant Tissue Culture and Secondary Metabolite Production Volume II.Plants (Basel). 2023 Nov 15;12(22):3862. doi: 10.3390/plants12223862. Plants (Basel). 2023. PMID: 38005758 Free PMC article.
-
Hypericum perforatum L. and the Underlying Molecular Mechanisms for Its Choleretic, Cholagogue, and Regenerative Properties.Pharmaceuticals (Basel). 2023 Jun 15;16(6):887. doi: 10.3390/ph16060887. Pharmaceuticals (Basel). 2023. PMID: 37375834 Free PMC article. Review.
-
Effects of Culture Period and Plant Growth Regulators on In Vitro Biomass Production and Phenolic Compounds in Seven Species of Hypericum.Plants (Basel). 2025 Aug 6;14(15):2437. doi: 10.3390/plants14152437. Plants (Basel). 2025. PMID: 40805786 Free PMC article.
References
-
- Danova K. Potential of the Balkan flora as a source of prospective Hypericum genotypes for the conventional and biotechnological delivery of phytopharmaceuticals. In: Davis H.R., editor. Hypericum: Botanical Sources, Medical Properties and Health Effects. Nova Science Publishers; New York, NY, USA: 2015. pp. 19–52. (Series Plant Science Research and Practices). Chapter 2.
-
- Vuko E., Dunkić V., Ruščić M., Nazlić M., Mandić N., Soldo B., Šprung M., Fredotović Ž. Chemical Composition and New Biological Activities of Essential Oil and Hydrosol of Hypericum perforatum L. ssp. veronense (Schrank) H. Lindb. Plants. 2021;10:1014. doi: 10.3390/plants10051014. - DOI - PMC - PubMed
Grants and funding
LinkOut - more resources
Full Text Sources
