Review
. 2022 Oct 13;14(20):4311.
doi: 10.3390/polym14204311.

Processes of Electrospun Polyvinylidene Fluoride-Based Nanofibers, Their Piezoelectric Properties, and Several Fantastic Applications

Affiliations
Review

Processes of Electrospun Polyvinylidene Fluoride-Based Nanofibers, Their Piezoelectric Properties, and Several Fantastic Applications

Yubin Bai et al. Polymers (Basel). .

Abstract

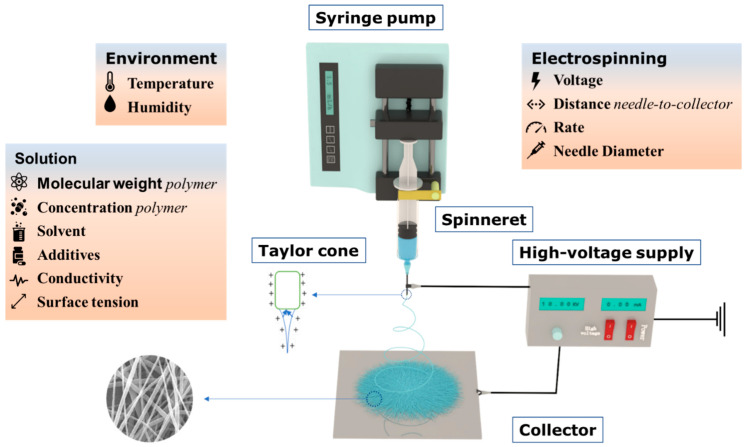
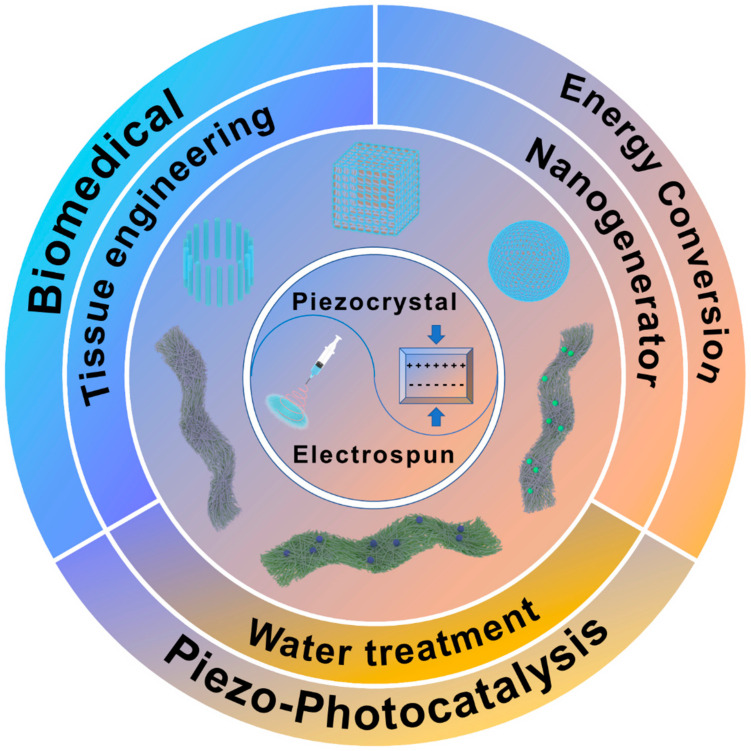
Since the third scientific and technological revolution, electronic information technology has developed rapidly, and piezoelectric materials that can convert mechanical energy into electrical energy have become a research hotspot. Among them, piezoelectric polymers are widely used in various fields such as water treatment, biomedicine, and flexible sensors due to their good flexibility and weak toxicity. However, compared with ceramic piezoelectric materials, the piezoelectric properties of polymers are poor, so it is very important to improve the piezoelectric properties of polymers. Electrospinning technology can improve the piezoelectric properties of piezoelectric polymers by adjusting electrospinning parameters to control the piezoelectrically active phase transition of polymers. In addition, the prepared nanofibrous membrane is also a good substrate for supporting piezoelectric functional particles, which can also effectively improve the piezoelectric properties of polymers by doping particles. This paper reviews the piezoelectric properties of various electrospun piezoelectric polymer membranes, especially polyvinylidene fluoride (PVDF)-based electrospun nanofibrous membranes (NFs). Additionally, this paper introduces the various methods for increasing piezoelectric properties from the perspective of structure and species. Finally, the applications of NFs in the fields of biology, energy, and photocatalysis are discussed, and the future research directions and development are prospected.

Keywords: biomedicines; electrospinning; energy; photocatalysis; piezoelectric properties; polyvinylidene fluoride.


Conflict of interest statement

The authors declare no conflict of interest.

Figures

Figure 1
Figure 1
Schematic diagram of positive piezoelectric effect and negative piezoelectric effect. (a,b) show the positive piezoelectric effect exerted by compressive and tensile forces, respectively, the arrows represent tensile and compressive forces. (c,d) represent the negative piezoelectric effect, which causes the piezoelectric material to shrink and elongate, respectively, the arrow represents the direction of the current.
Figure 2
Figure 2
Electrospinning schematic diagram and influencing parameters.
Figure 3
Figure 3
Molecular structure of the α, β, and γ phases of PVDF.
Figure 4
Figure 4
(1) SEM images of surface morphology of electrospun PVDF fibers under different applied voltage levels (a,e,i) 6 kV; (b,f,j) 12 kV; (c,g,k) 18 kV; (d,h,l) 24 kV. Reprinted with permission from Ref. [86], copyright 2019, IOP Publishing. (2) curves of percentage of β phase in PVDF NFs and voltage values of 10, 12, 15, 18, 22.5, and 27 kV. Reprinted with permission from Ref. [88], copyright 2021, Polymer. (3) SEM images of surface morphology of electrospun PVDF fibers at different flow rates (a,d,g) 1 mL/h; (b,e,h) 2 mL/h; (c,f,i) 2.5 mL/h. Reprinted with permission from Ref. [86], copyright 2019, IOP Publishing. (4) (a) Relationship between the proportion of β phase of PVDF NFs and the size of the needle eye (flow rate 2.0 mL/h). (b) Relationship between the percentage of β phase and the flow rate of solution (needle diameter 0.6 mm). Reprinted with permission from Ref. [88], copyright 2021, Polymer.
Figure 5
Figure 5
(1) SEM images of electrospun PVDF NFs with different molecular weights (MWs) (a,d) 180 × 103; (b,e) 275 × 103; (c,f) 530 × 103. Reprinted with permission from Ref. [99], copyright 2019, Taylor & Francis. (2) Piezoelectric effect of PVDF NFs under different MWs. (a) Voltage output. (b) Statistical results of average voltage output. (c) Statistical results of average current output. Reprinted with permission from Ref. [99], copyright 2019, Taylor & Francis. (3) SEM images of PVDF NFs with different concentrations (a) 29 wt%; (b) 32 wt%; (c) 35 wt%. Reprinted with permission from Ref. [102], copyright 2011, Polymer. (4) WAXD (a) and FTIR spectra of PVDF fibrous membranes (b). Reprinted with permission from Ref. [102], copyright 2011, Polymer. (5) XRD patterns of PVDF NFs at ambient temperature (a) 15 °C (b) 25 °C (c) 35 °C (d) 45 °C. Reprinted with permission from Ref. [103], copyright 2008, Walter De Gruyter GmbH. (6) FE-SEM images of PVDF NFs prepared at different ambient temperatures. Reprinted with permission from Ref. [103], copyright 2008, Walter De Gruyter GmbH.
Figure 6
Figure 6
(1) Raman spectroscopy results of pure PVDF and PVDF containing 0.8 wt% BaTiO3. Reprinted with permission from Ref. [117], copyright 2021, Elsevier. (2) Voltage curve of PVDF−BatiO3−Ag composite as a function of time. Reprinted with permission from Ref. [117], copyright 2021, Elsevier. (3) Schematic diagram of modified nanographene to promote β−phase generation. Reprinted with permission from Ref. [111], copyright 2021, MDPI. (4) the piezoelectric signals of the fiber membrane when different amounts of modified nanographene were added. Reprinted with permission from Ref. [111], copyright 2021, MDPI.
Figure 7
Figure 7
(1) The macroscopic and microscopic structure and state diagram of the material, (a) the schematic diagram of the synthesis route of two-dimensional MOF (CdI2−NAP) and its unit structure. (b) MOF structure (top), XRD (bottom). (c,d) electrospinning. (e,f) photos of C−PNG. (g) FE-SEM images of composite NFs, inset shows a histogram of fiber diameter distribution. Reprinted with permission from Ref. [126], copyright 2021, American Chemical Society. (2) Analysis of piezoelectric properties during human movement, (a) voltage responses of C−PNGs attached to a wrist, (b) elbow, (c) neck, (d) knee, (e) toe, and (f) heel movements, the arrows represent pressure and release. (g) Simulation based on FEM. (h) Voltage response curves of C−PNGs attached to the throat during “acoustic,” “motor,” and “naphthene” vocations. Reprinted with permission from Ref. [126], copyright 2021, American Chemical Society.
Figure 8
Figure 8
(1) Analysis of PVDF and PVDF–TRFE NFs, and (a) Molecular structure of PVDF–TRFE. (b) XRD patterns of randomly oriented PVDF and PVDF–TRFE NFs. (c) XRD patterns of PVDF and PVDF–TRFE fibers arranged in order. Reprinted with permission from Ref. [127], copyright 2020, SAGE Publications Ltd. STM. (2) PNG analysis, (a) Schematic diagram of the structure of PNG. Statistical results of (b) output voltage, (c) output current, (d) average voltage, and current generated by PNG during folding and release at 90° bending. Reprinted with permission from Ref. [127], copyright 2020, SAGE Publications Ltd. STM.
Figure 9
Figure 9
(1) PNG structure diagram and its voltage, current, and biocompatibility test, (a) Schematic diagram and photo of PNG. (b) Open−circuit voltage and short−circuit current before and after PNG packaging. (c) Fluorescence images and viability of MEF cells after 1, 2, and 3 days of culture on composite fibrous membranes, encapsulated layers of PNG, and cell culture dishes. Reprinted with permission from Ref. [129], copyright 2021, Elsevier. (2) Self−powered cardiac pacemakers and (a) surgical procedures in animal experiments. (b) Photographs of the heart and (c) ECG signals and blood pressure recorded simultaneously. (d) PNG stitched to the epicardium facing the left outdoor lateral wall (e) In vivo ECG signal, open−circuit voltage, and short-circuit current of PNG. (f) Energy generated by PNG. (g) Charging curve of a 100 μF capacitor charged by PNG. (h) Pacing pulses generated by a PNG−powered pacemaker. Reprinted with permission from Ref. [129], copyright 2021, Elsevier.
Figure 10
Figure 10
Structures and applications of other piezoelectric NFs prepared by electrospinning.
Figure 11
Figure 11
Application of electrospun piezoelectric NFs.
Figure 12
Figure 12
(1) Histological morphology at week 12: (a) negative control. (b) Positive control. (c) PLLA. (d) PLLA/rhBMP-2. Reprinted with permission from Ref. [185], copyright 2011, Public Library of Science. (2) The relationship between new bone formation and the whole defect area, * p < 0.05. Reprinted with permission from Ref. [185], copyright 2011, Public Library of Science. (3) Schematic diagram of arterial pulse-sensing device. Reprinted with permission from Ref. [114], copyright 2020, American Chemical Society. (4) Surface characteristics and piezoelectric response of PVDF NFs. (a,d,g) and (b,e,h) atomic force microscopy. (c,f,i) Voltage curves showing the piezoelectric response of the NFs. Reprinted with permission from Ref. [114], copyright 2020, American Chemical Society.
Figure 13
Figure 13
(1) Fabrication process of nano-electric eel, (a) Au sputtering and electrodeposition of Au plug layer in an AAO membrane, (b) electrodeposition of Ppy NWs, followed by (c) their dehydration and the pore widening of AAO template to allow for (d) sequential electrodeposition of Ni and Au nanoring segments. (e) Vacuum infiltration to form PVDF NWs, and RIE etching. Wet etching of (f) AAO template and (g) etching of gold nanoring segments to obtain released hybrid nano-electric eel. Reprinted with permission from Ref. [190], copyright 2019, John Wiley & Sons, Ltd. (2) Controlled drug release of mixed nano-electric eel. (a) Schematic representation of the magnetic drug release from mixed nano-electric eel. (b) Continuous release of RhB at 10 mT and 7 Hz. (c) The amount of RhB released with and without magnetic field. (d) Release plots of RhB in NWs without PVDF, with PVDF–HFP, and with PVDF–TRFE, bright-field and fluorescence images of cancer cells cultured with Adriamycin-coated PVDF–TRFE NWs in (e) swimming mode and (f) drug release mode. Reprinted with permission from Ref. [190], copyright 2019, John Wiley & Sons, Ltd.
Figure 14
Figure 14
Band-structure changes before (1) and after (2) strain, and the energy shift on the occupied and unoccupied states. Reprinted with permission from Ref. [191], copyright 2015, Elsevier.
Figure 15
Figure 15
ELF basin analysis of the optimized geometry of (1) (a) Zr−oxo and (b) HF−oxo clusters. Reprinted with permission from Ref. [14], copyright 2021, John Wiley & Sons, Ltd. (2) Schematic diagram of β-phase formation in MoS2/PVDF. Reprinted with permission from Ref. [192], copyright 2021, Elsevier. (3) the mechanism of interfacial charge transfer process under the influence of band structure and band bending. Reprinted with permission from Ref. [192], copyright 2021, Elsevier. (4) Piezoelectric photocatalysis principle of TiO2/PVDF. Reprinted with permission from Ref. [196], copyright 2022, Elsevier.
Figure 16
Figure 16
(1) The electric energy made by PNG is used to drive the electric heating plate. (a) Schematic diagram of self-heating insole. Digital photo and infrared image of the output voltage generated by PNG during (b) walking and (c) running, the blue inset is a partial enlargement of the red box, (d) insole. Reprinted with permission from Ref. [146], copyright 2020, American Chemical Society. (2) (a) Plot of voltage response as a function of time for different applied pressures under finger impingement. (b) Output voltage response of PNG with polystyrene, matchstick, and weight placed at the top. Piezo−response plots for loading and unloading cycles under (c) bending and (d) blower pressure. Reprinted with permission from Ref. [203], copyright 2018, Elsevier.

References

    1. Mason W.P. Piezoelectricity, its history and applications. J. Acoust. Soc. Am. 1981;70:1561–1566. doi: 10.1121/1.387221. - DOI
    1. Curie P., Curie J. Développement par compression de l’électricité polaire dans les cristaux hémièdres à faces inclinées. Bull. Minéral. 1880;3:90–93. doi: 10.3406/bulmi.1880.1564. - DOI
    1. Sirohi J., Chopra I. Fundamental understanding of piezoelectric strain sensors. J. Intell. Mater. Syst. Struct. 2000;11:246–257. doi: 10.1106/8BFB-GC8P-XQ47-YCQ0. - DOI
    1. Bowen C.R., Kim H.A., Weaver P.M., Dunn S. Piezoelectric and ferroelectric materials and structures for energy harvesting applications. Energy Environ. Sci. 2014;7:25–44. doi: 10.1039/C3EE42454E. - DOI
    1. Chang J., Dommer M., Chang C., Lin L. Piezoelectric nanofibers for energy scavenging applications. Nano Energy. 2012;1:356–371. doi: 10.1016/j.nanoen.2012.02.003. - DOI

LinkOut - more resources