

A Deep Learning Approach to Organic Pollutants Classification Using Voltammetry
- PMID: 36298383
- PMCID: PMC9608622
- DOI: 10.3390/s22208032
A Deep Learning Approach to Organic Pollutants Classification Using Voltammetry
Abstract
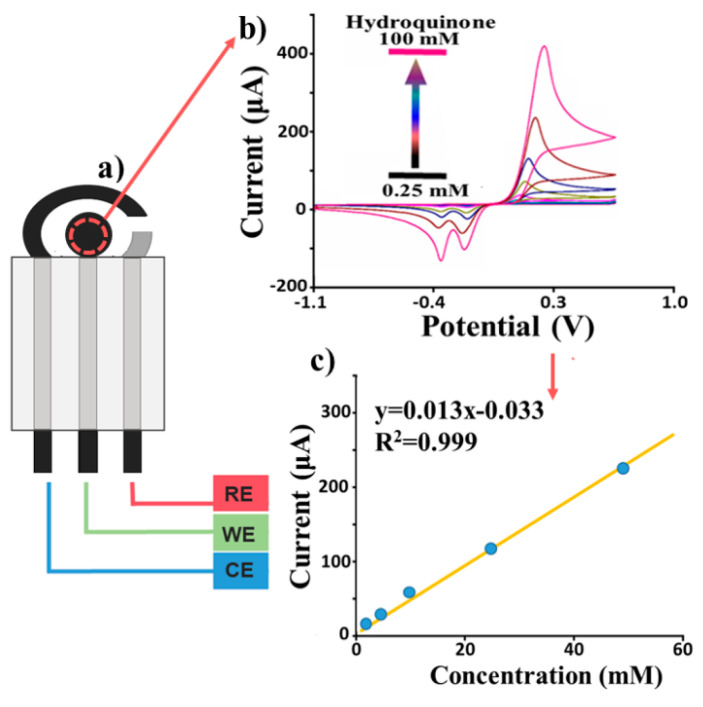
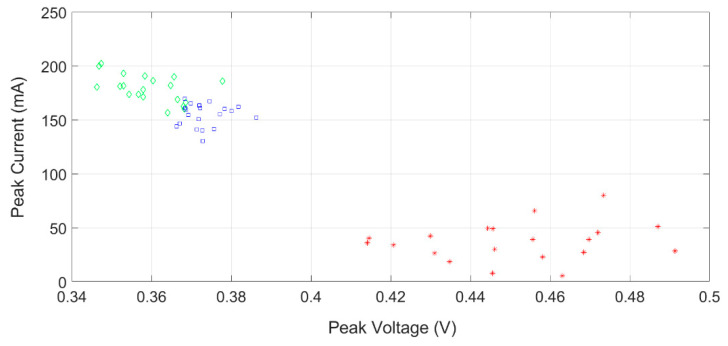
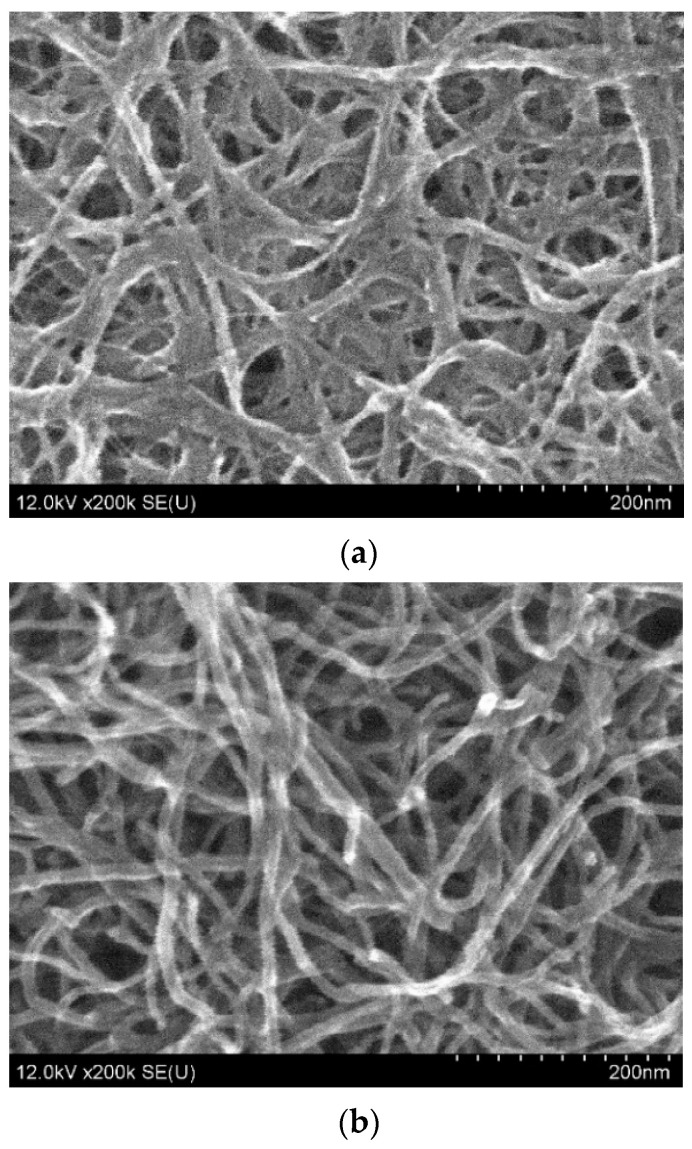
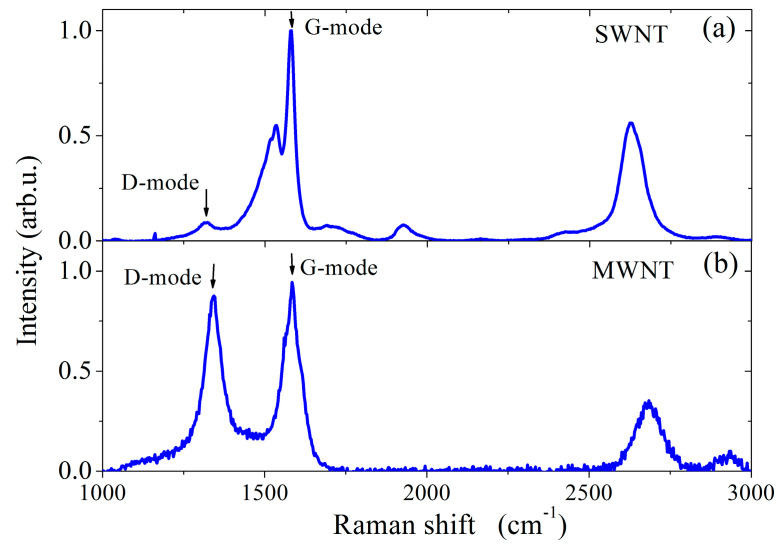
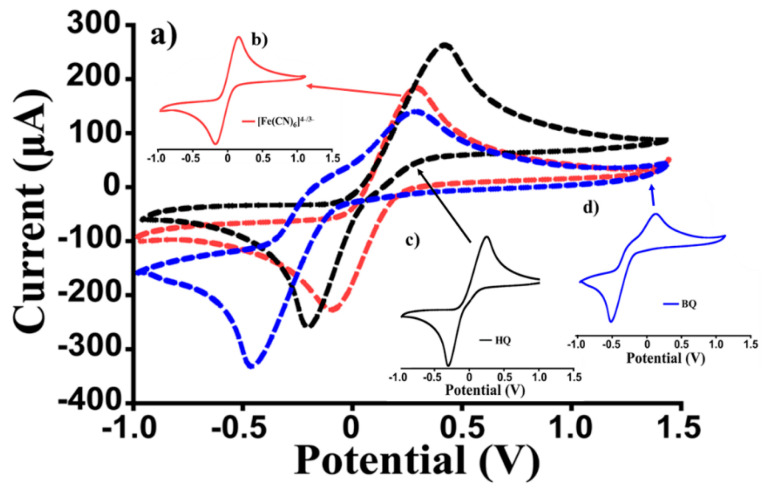
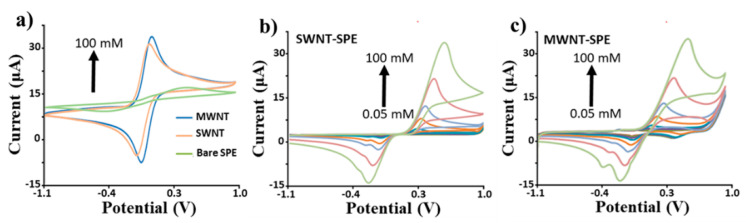
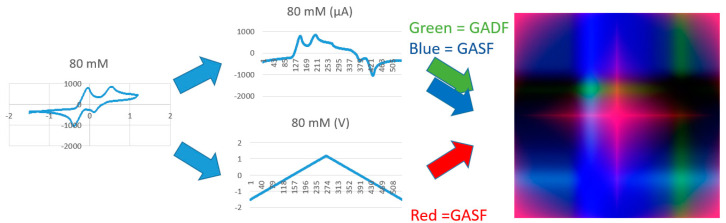
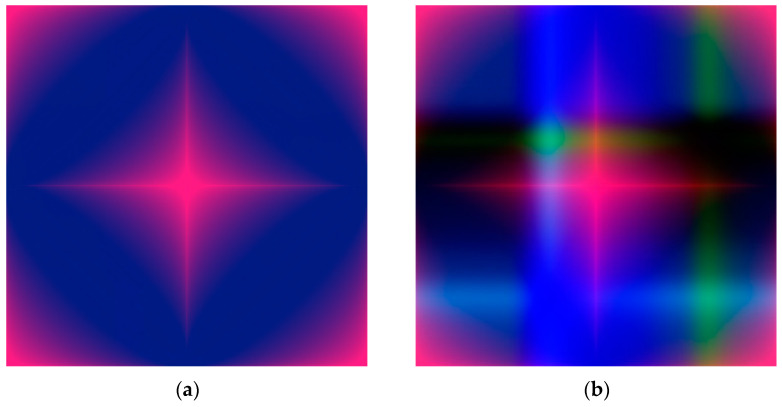
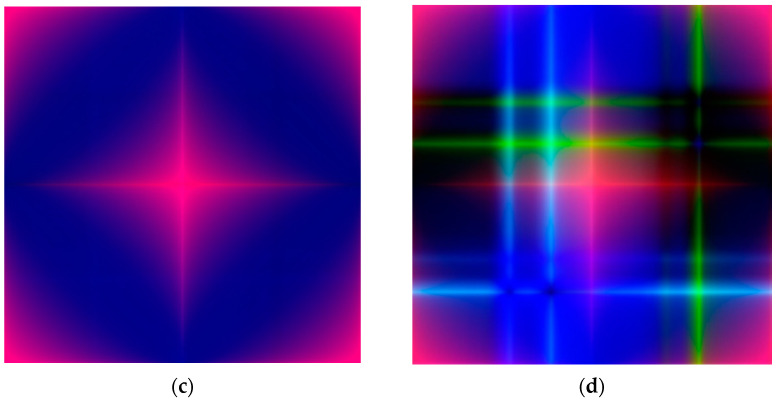
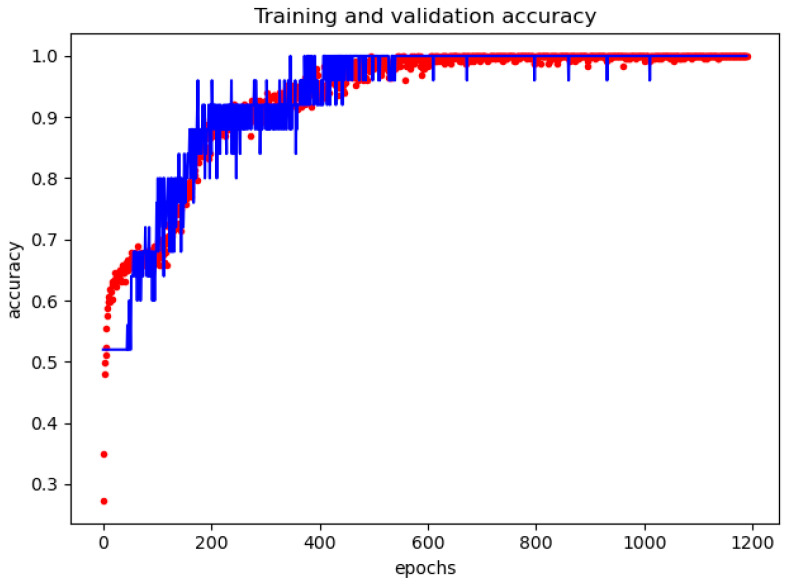
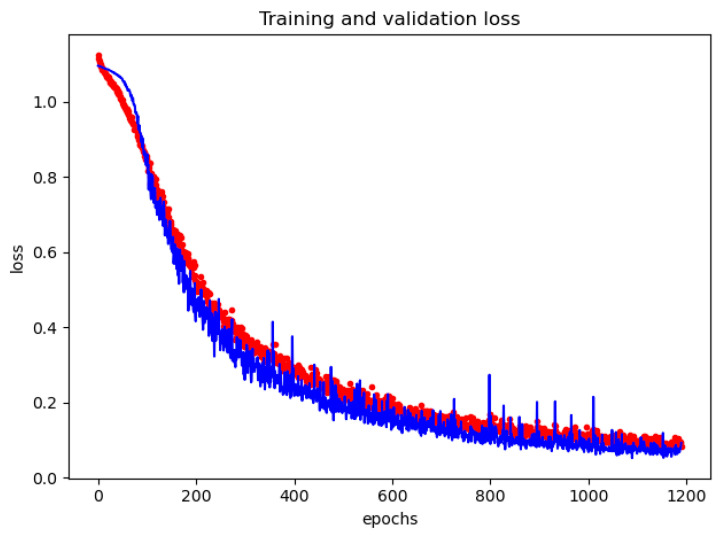
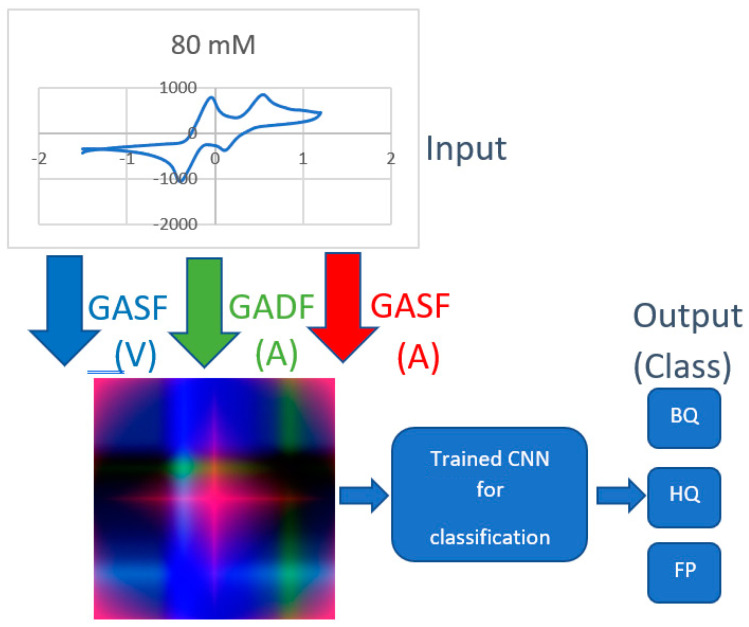
This paper proposes a deep leaning technique for accurate detection and reliable classification of organic pollutants in water. The pollutants are detected by means of cyclic voltammetry characterizations made by using low-cost disposable screen-printed electrodes. The paper demonstrates the possibility of strongly improving the detection of such platforms by modifying them with nanomaterials. The classification is addressed by using a deep learning approach with convolutional neural networks. To this end, the results of the voltammetry analysis are transformed into equivalent RGB images by means of Gramian angular field transformations. The proposed technique is applied to the detection and classification of hydroquinone and benzoquinone, which are particularly challenging since these two pollutants have a similar electroactivity and thus the voltammetry curves exhibit overlapping peaks. The modification of electrodes by carbon nanotubes improves the sensitivity of a factor of about ×25, whereas the convolution neural network after Gramian transformation correctly classifies 100% of the experiments.
Keywords: carbon nanotubes; convolutional neural networks; cyclic voltammetry; pollutant detection; screen-printed electrodes.
Conflict of interest statement
The authors declare no conflict of interest.
Figures

References
-
- Avino P., Russo M.V. A Comprehensive Review of Analytical Methods for Determining Persistent Organic Pollutants in Air, Soil, Water and Waste. Curr. Org. Chem. 2018;22:939–953. doi: 10.2174/1385272822666180404144834. - DOI
-
- Moldovan Z., Popa D.E., David I.G., Buleandra M., Badea I.A. A Derivative Spectrometric Method for Hydroquinone Determination in the Presence of Kojic Acid, Glycolic Acid, and Ascorbic Acid. J. Spectrosc. 2017;2017:6929520. doi: 10.1155/2017/6929520. - DOI
-
- Zhang M., Ge C., Jin Y., Hu L., Mo H., Li X., Zhang H. Sensitive and Simultaneous Determination of Hydroquinone and Catechol in Water Using an Anodized Glassy Carbon Electrode with Polymerized 2-(Phenylazo) Chromotropic Acid. J. Chem. 2019;2019:2327064. doi: 10.1155/2019/2327064. - DOI
-
- Barton J., García M.B.G., Santos D.H., Fanjul-Bolado P., Ribotti A., McCaul M., Diamond D., Magni P. Screen-printed electrodes for environmental monitoring of heavy metal ions: A review. Microchim. Acta. 2016;183:503–517. doi: 10.1007/s00604-015-1651-0. - DOI
MeSH terms
Substances
Grants and funding
LinkOut - more resources
Full Text Sources
