. 2022 Oct 19;10(10):1747.
doi: 10.3390/vaccines10101747.

Identifying Modifiable Predictors of COVID-19 Vaccine Side Effects: A Machine Learning Approach

Affiliations

Identifying Modifiable Predictors of COVID-19 Vaccine Side Effects: A Machine Learning Approach

Sara Abbaspour et al. Vaccines (Basel). .

Abstract

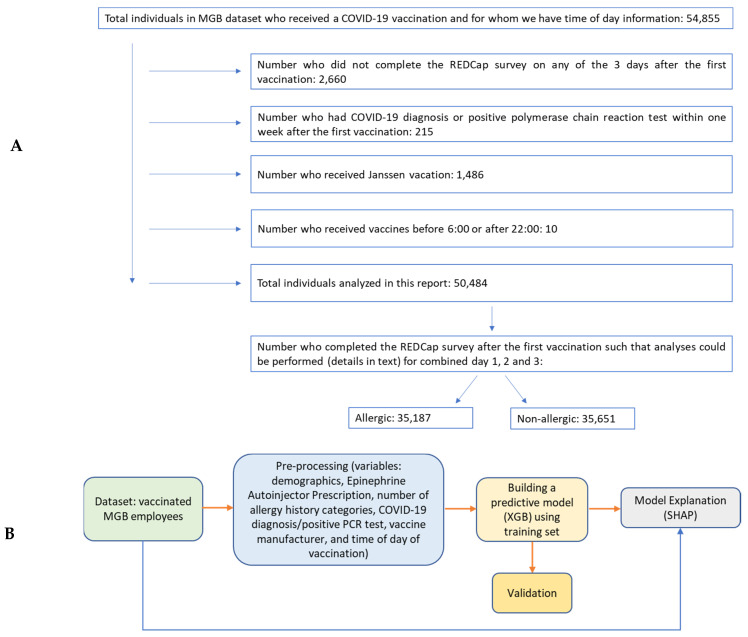
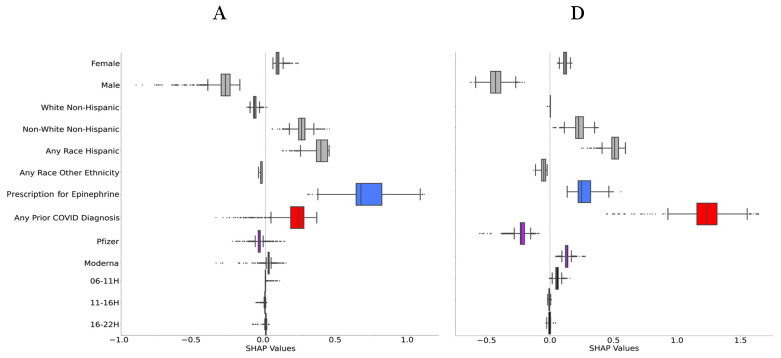
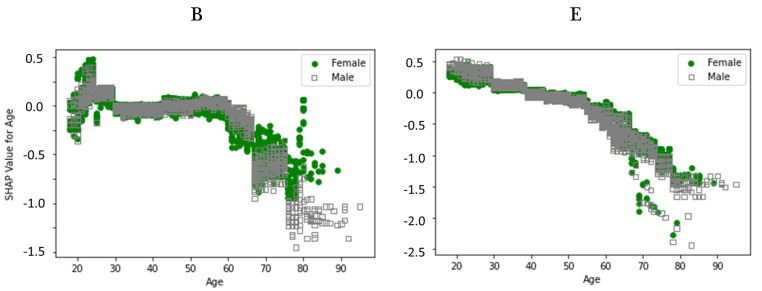
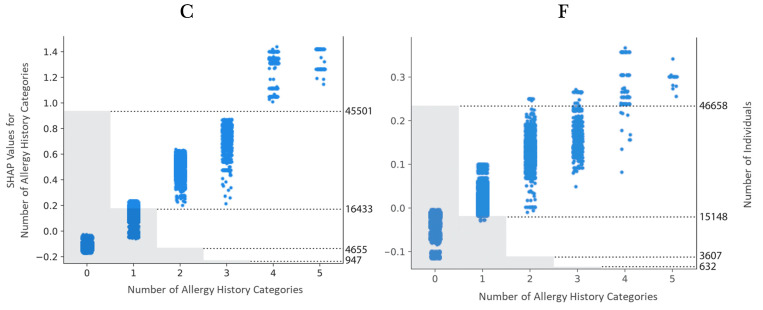
Side effects of COVID-19 or other vaccinations may affect an individual's safety, ability to work or care for self or others, and/or willingness to be vaccinated. Identifying modifiable factors that influence these side effects may increase the number of people vaccinated. In this observational study, data were from individuals who received an mRNA COVID-19 vaccine between December 2020 and April 2021 and responded to at least one post-vaccination symptoms survey that was sent daily for three days after each vaccination. We excluded those with a COVID-19 diagnosis or positive SARS-CoV2 test within one week after their vaccination because of the overlap of symptoms. We used machine learning techniques to analyze the data after the first vaccination. Data from 50,484 individuals (73% female, 18 to 95 years old) were included in the primary analysis. Demographics, history of an epinephrine autoinjector prescription, allergy history category (e.g., food, vaccine, medication, insect sting, seasonal), prior COVID-19 diagnosis or positive test, and vaccine manufacturer were identified as factors associated with allergic and non-allergic side effects; vaccination time 6:00-10:59 was associated with more non-allergic side effects. Randomized controlled trials should be conducted to quantify the relative effect of modifiable factors, such as time of vaccination.

Keywords: COVID-19; allergy; machine learning; model explanation; side effects; time-of-day-effects; vaccination.


Conflict of interest statement

S.A.; D.H.; K.H.; S.S.M.: None. G.K.R.: Trial support from Leonard Meron Bioscience, Consulting for Teradyne Inc; outside the submitted work. Member of the DHHS OI guidelines. K.G.B.: Grant support from Phadia Ab (Thermo Fisher Scientific); personal fees for legal case review from Weekley Shulte Valdes Murman Tonelli, Piedmont Liability Trust, Vasios Kelly and Strollo PA, and Publix Supermarkets; and royalties from UpToDate, all outside the submitted work. E.S.S.: a writer for Up To Date; outside the submitted work. W.W.: Consultancy for National Sleep Foundation, outside the submitted work. E.B.K.: Consulting for American Academy of Sleep Medicine Foundation, Circadian Therapeutics National Sleep Foundation, Sleep Research Society Foundation, Yale University Press; travel support from European Biological Rhythms Society; partner owns Chronsulting. All outside the submitted work.

Figures

Figure 1
Figure 1
(A): Creation of dataset; (B): Block diagram illustrating the processing stages used in this study to identify predictors of post COVID-19 vaccine-related side effects.
Figure 2
Figure 2
Feature importance plot using the mean absolute SHAP values for (A): allergic side effects and (B): non-allergic side effects. Colors: grey—demographics, blue—allergy history category/prescription for Epinephrine, red—any prior COVID diagnosis or positive test, purple—vaccine manufacturer, black—time-of-day of vaccination.
Figure 3
Figure 3
(A): SHAP value boxplot that shows the direction of impact of each variable on model’s output for allergic side effects. Positive SHAP values are indicative of having side effects, while negative SHAP values are indicative of not having side effects. Box limits indicate 25th and 75th percentile, vertical line within the box indicates 50th percentile, and other vertical lines indicate 5th and 95th percentiles; (B): SHAP feature independent plot for age vs. sex showing the impact of age on model output and (C): SHAP value scatter plot for number of allergy history categories showing the impact of this variable on model output. (DF): as in (AC) except for non-allergic side effects. Colors in (A,D): grey—demographics, blue—prescription for epinephrine, red—any prior COVID diagnosis or positive test, purple—vaccine manufacturer, black—time-of-day of vaccination.
Figure 3
Figure 3
(A): SHAP value boxplot that shows the direction of impact of each variable on model’s output for allergic side effects. Positive SHAP values are indicative of having side effects, while negative SHAP values are indicative of not having side effects. Box limits indicate 25th and 75th percentile, vertical line within the box indicates 50th percentile, and other vertical lines indicate 5th and 95th percentiles; (B): SHAP feature independent plot for age vs. sex showing the impact of age on model output and (C): SHAP value scatter plot for number of allergy history categories showing the impact of this variable on model output. (DF): as in (AC) except for non-allergic side effects. Colors in (A,D): grey—demographics, blue—prescription for epinephrine, red—any prior COVID diagnosis or positive test, purple—vaccine manufacturer, black—time-of-day of vaccination.
Figure 4
Figure 4
SHAP Waterfall plots exampling local/individual predictions for 4 individuals showing the contribution of each variable to the prediction. The gray text in front of each variable name is the value of the particular variable. The baseline value (E[f(X)]) is displayed below the x-axis, indicating the expected value of the model. The model output for each individual (f(x)) is shown on top of each panel; it is the sum of SHAP values calculated for all variables. Positive SHAP values push the model to predict having side effects, while negative SHAP values push the model to predict no side effects. Allergic side effects: (A): a 28 year old white Non-Hispanic male who received Moderna between 16 and 21:59. (B): a 28 year old male with any race Other Ethnicity who received Moderna between 16 and 21:59; Non-allergic side effects: (C): a 28 year old white Non-Hispanic female who received Pfizer between 11 and 15:59, and (D): a 28 year old male with any race Hispanic who received Moderna between 06 and 10:59. Absolute SHAP values < 0.01 were not presented on the figures. Colors: grey—demographics, blue—allergy history category/prescription for epinephrine, red—any prior COVID diagnosis or positive test, purple—vaccine manufacturer, black—time-of-day of vaccination.
Figure 4
Figure 4
SHAP Waterfall plots exampling local/individual predictions for 4 individuals showing the contribution of each variable to the prediction. The gray text in front of each variable name is the value of the particular variable. The baseline value (E[f(X)]) is displayed below the x-axis, indicating the expected value of the model. The model output for each individual (f(x)) is shown on top of each panel; it is the sum of SHAP values calculated for all variables. Positive SHAP values push the model to predict having side effects, while negative SHAP values push the model to predict no side effects. Allergic side effects: (A): a 28 year old white Non-Hispanic male who received Moderna between 16 and 21:59. (B): a 28 year old male with any race Other Ethnicity who received Moderna between 16 and 21:59; Non-allergic side effects: (C): a 28 year old white Non-Hispanic female who received Pfizer between 11 and 15:59, and (D): a 28 year old male with any race Hispanic who received Moderna between 06 and 10:59. Absolute SHAP values < 0.01 were not presented on the figures. Colors: grey—demographics, blue—allergy history category/prescription for epinephrine, red—any prior COVID diagnosis or positive test, purple—vaccine manufacturer, black—time-of-day of vaccination.

References

    1. CDC COVID-19 Vaccines Work. [(accessed on 1 August 2022)];2021 Available online: https://www.cdc.gov/coronavirus/2019-ncov/vaccines/effectiveness/work.html.
    1. Coronavirus (COVID-19) Vaccinations. 2022. [(accessed on 1 August 2022)]. Available online: https://ourworldindata.org/covid-vaccinations.
    1. Azarpanah H., Farhadloo M., Vahidov R., Pilote L. Vaccine hesitancy: Evidence from an adverse events following immunization database, and the role of cognitive biases. BMC Public Health. 2021;21:1686. doi: 10.1186/s12889-021-11745-1. - DOI - PMC - PubMed
    1. Biswas N., Mustapha T., Khubchandani J., Price J.H. The nature and extent of COVID-19 vaccination hesitancy in healthcare workers. J. Community Health. 2021;46:1244–1251. doi: 10.1007/s10900-021-00984-3. - DOI - PMC - PubMed
    1. Shenoy E.S., Wickner P.G., West L.R., Banerji A., Blumenthal K.G., Centi A.J., Gottlieb A., Hashimoto D.M., Kim E., Kim M., et al. Symptom monitoring after coronavirus disease 2019 (COVID-19) vaccination in a large integrated healthcare system: Separating symptoms from severe acute respiratory coronavirus virus 2 (SARS-CoV-2) infection. Infect. Control Hosp. Epidemiol. 2021:1–8. doi: 10.1017/ice.2021.449. - DOI - PMC - PubMed