

Molecular Epidemiology of HIV-1 in Eastern Europe and Russia
- PMID: 36298654
- PMCID: PMC9609922
- DOI: 10.3390/v14102099
Molecular Epidemiology of HIV-1 in Eastern Europe and Russia
Abstract
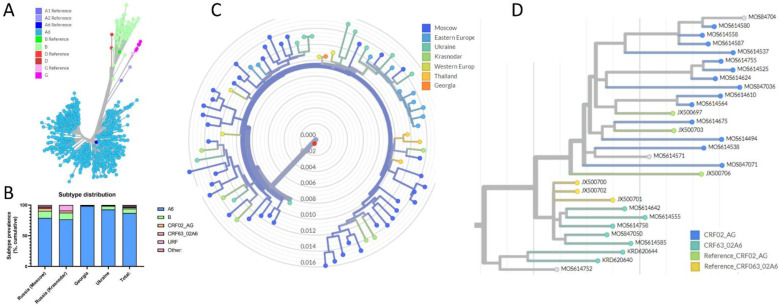
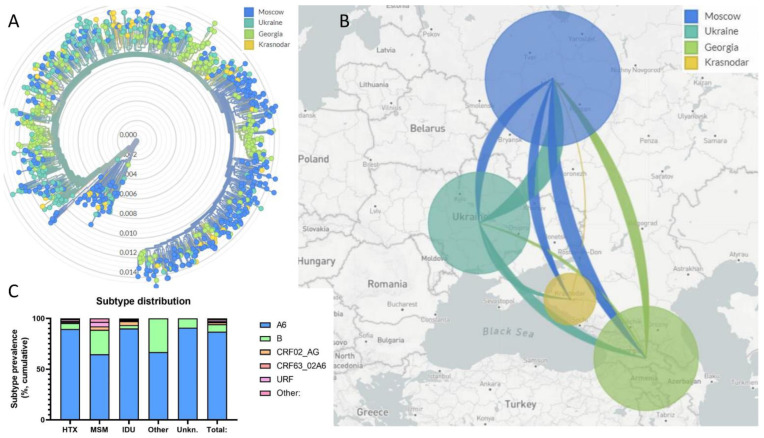
The HIV epidemic in Eastern Europe and Russia is large and not well-controlled. To describe the more recent molecular epidemiology of HIV-1, transmitted drug resistance, and the relationship between the epidemics in this region, we sequenced the protease and reverse transcriptase genes of HIV-1 from 812 people living with HIV from Ukraine (n = 191), Georgia (n = 201), and Russia (n = 420) before the initiation of antiretroviral therapy. In 190 Ukrainian patients, the integrase gene sequence was also determined. The most reported route of transmission was heterosexual contact, followed by intravenous drug use, and men having sex with men (MSM). Several pre-existing drug resistance mutations were found against non-nucleoside reverse transcriptase inhibitors (RTIs) (n = 103), protease inhibitors (n = 11), and nucleoside analogue RTIs (n = 12), mostly polymorphic mutations or revertants. In the integrase gene, four strains with accessory integrase strand transfer inhibitor mutations were identified. Sub-subtype A6 caused most of the infections (713/812; 87.8%) in all three countries, including in MSM. In contrast to earlier studies, no clear clusters related to the route of transmission were identified, indicating that, within the region, the exchange of viruses among the different risk groups may occur more often than earlier reported.
Keywords: Eastern Europe; HIV-1 sub-subtype A6; epidemiology; phylogeny; pre-existing drug resistance mutations; unique recombinant forms.
Conflict of interest statement
The authors declare no conflict of interest. The funders had no role in the design of the study; in the collection, analyses, or interpretation of data; in the writing of the manuscript; or in the decision to publish the results.
Figures
Similar articles
-
Epidemiology and Transmitted HIV-1 Drug Resistance among Treatment-Naïve Individuals in Israel, 2010-2018.Viruses. 2021 Dec 31;14(1):71. doi: 10.3390/v14010071. Viruses. 2021. PMID: 35062274 Free PMC article.
-
Changes in Primary HIV-1 Drug Resistance Due to War Migration from Eastern Europe.J Immigr Minor Health. 2024 Feb;26(1):15-22. doi: 10.1007/s10903-023-01559-1. Epub 2023 Nov 16. J Immigr Minor Health. 2024. PMID: 37973713 Free PMC article.
-
Frequency of genotypic factors possibly associated with cabotegravir/rilpivirine failure in antiretroviral treatment-naïve and -experienced HIV-1- infected population.Infect Genet Evol. 2022 Oct;104:105358. doi: 10.1016/j.meegid.2022.105358. Epub 2022 Aug 31. Infect Genet Evol. 2022. PMID: 36057423
-
Molecular epidemiology of HIV-1 infection in Europe: An overview.Infect Genet Evol. 2016 Dec;46:180-189. doi: 10.1016/j.meegid.2016.06.033. Epub 2016 Jun 16. Infect Genet Evol. 2016. PMID: 27321440 Review.
-
Relationships among various nucleoside resistance-conferring mutations in the reverse transcriptase of HIV-1.J Antimicrob Chemother. 2004 Jan;53(1):53-7. doi: 10.1093/jac/dkh009. Epub 2003 Nov 25. J Antimicrob Chemother. 2004. PMID: 14645322 Review.
Cited by
-
Incorporating temporal dynamics of mutations to enhance the prediction capability of antiretroviral therapy's outcome for HIV-1.Bioinformatics. 2024 Jun 3;40(6):btae327. doi: 10.1093/bioinformatics/btae327. Bioinformatics. 2024. PMID: 38775719 Free PMC article.
-
Cohort Profile: A European Multidisciplinary Network for the Fight against HIV Drug Resistance (EuResist Network).Trop Med Infect Dis. 2023 Apr 23;8(5):243. doi: 10.3390/tropicalmed8050243. Trop Med Infect Dis. 2023. PMID: 37235291 Free PMC article.
-
Phylodynamics analysis of HIV epidemic history in Belarus in 1987-2022.Front Epidemiol. 2025 Jul 21;5:1601976. doi: 10.3389/fepid.2025.1601976. eCollection 2025. Front Epidemiol. 2025. PMID: 40761738 Free PMC article.
-
HIV-1 transmitted drug resistance in newly diagnosed individuals in Italy over the period 2015-21.J Antimicrob Chemother. 2024 Sep 3;79(9):2152-2162. doi: 10.1093/jac/dkae189. J Antimicrob Chemother. 2024. PMID: 39028674 Free PMC article.
-
Hospitalizations and deaths among people coinfected with HIV and HCV.Sci Rep. 2024 Nov 19;14(1):28586. doi: 10.1038/s41598-024-80289-2. Sci Rep. 2024. PMID: 39562714 Free PMC article.
References
-
- Europe 2021 Report by the European Centre for Disease Prevention and Control/WHO Regional Office for Europe 2021. [(accessed on 1 July 2022)]. Available online: https://www.ecdc.europa.eu/sites/default/files/documents/2021-Annual_HIV....
-
- Rospotrebnadzor Report (HIV Infection in the Russian Federation, 2020) [(accessed on 1 July 2022)]. Available online: http://www.hivrussia.info/dannye-po-vich-infektsii-v-rossii/
Publication types
MeSH terms
Substances
LinkOut - more resources
Full Text Sources
Medical
Molecular Biology Databases
