. 2022 Sep 24;14(10):2114.
doi: 10.3390/v14102114.

Model-Based Analysis of SARS-CoV-2 Infections, Hospitalization and Outcome in Germany, the Federal States and Districts

Affiliations

Model-Based Analysis of SARS-CoV-2 Infections, Hospitalization and Outcome in Germany, the Federal States and Districts

Christiane Dings et al. Viruses. .

Abstract

The coronavirus disease 2019 (COVID-19) pandemic challenged many national health care systems, with hospitals reaching capacity limits of intensive care units (ICU). Thus, the estimation of acute local burden of ICUs is critical for appropriate management of health care resources. In this work, we applied non-linear mixed effects modeling to develop an epidemiological SARS-CoV-2 infection model for Germany, with its 16 federal states and 400 districts, that describes infections as well as COVID-19 inpatients, ICU patients with and without mechanical ventilation, recoveries, and fatalities during the first two waves of the pandemic until April 2021. Based on model analyses, covariates influencing the relation between infections and outcomes were explored. Non-pharmaceutical interventions imposed by governments were found to have a major impact on the spreading of SARS-CoV-2. Patient age and sex, the spread of variant B.1.1.7, and the testing strategy (number of tests performed weekly, rate of positive tests) affected the severity and outcome of recorded cases and could reduce the observed unexplained variability between the states. Modeling could reasonably link the discrepancies between fine-grained model simulations of the 400 German districts and the reported number of available ICU beds to coarse-grained COVID-19 patient distribution patterns within German regions.

Keywords: SARS-CoV-2; age; coronavirus disease 2019 (COVID-19); intensive care; mathematical model; non-pharmaceutical interventions; sex; testing strategy; variant of concern (VOC).


Conflict of interest statement

The authors declare no conflict of interest.

Figures

Figure 1
Figure 1
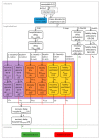
Schematic representation of the epidemiological compartment model. Solid arrows indicate the flow of individuals between compartments during the infection/disease process. Covariates influencing the flow rates are assigned to the respective arrows. Dashed arrows indicate the influence of a compartment value on the rates. NPI: non-pharmaceutical interventions, VOC: fraction of cases infected with the variant of concern B.1.1.7, number of tests: number of weekly performed PCR tests in Germany.
Figure 2
Figure 2
Detailed depiction of the compartmental model including flow rate constants. Numbers represent the compartment numbers used in the NONMEM model file. Not depicted are compartment numbers 18, 21, and 22, which were used for the computation of daily deaths, daily hospitalizations, and cumulative ICU patients. The violet, orange, and yellow areas represent the compartments used for the calculation of inpatients, ICU patients, and ventilated patients, respectively, according to Equations (A52)–(A54) (see Appendix A).
Figure 3
Figure 3
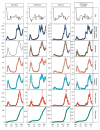
Descriptive performance plots for Germany and three selected federal states. Points: observations, lines: individual model predictions. Information about the total number of inpatients was not available for Germany in total.
Figure 4
Figure 4
Changes in effective reproductive number over time for Germany (red line) and the federal states (grey lines).
Figure 5
Figure 5
Fractions of confirmed cases hospitalized, treated in an ICU, and ventilated and death rates stratified by age and sex as extracted from the clinical database and data from RKI.
Figure 6
Figure 6
Age (A1) and sex (A2) distribution of confirmed cases over time. Relative changes in fractions of confirmed cases hospitalized, treated in an ICU, and ventilated (B1) as well as death rates (B2) resulting from changes in the age and sex distributions of the confirmed cases over time.
Figure 7
Figure 7
Fraction of infections with VOC B.1.1.7 in Germany (left) and impact of VOC B.1.1.7 on the infectiousness, fraction of patients requiring inpatient treatment, and fraction of inpatients requiring ICU treatment (right). Points indicate observed fraction of infections in Germany. Lines indicate the model-predicted fraction or rate changes.
Figure 8
Figure 8
(A) Weekly PCR tests in Germany. Blue lines indicate the change in the hospitalization rate vs. the number of tests performed (left plot) and time (right plot). The histogram represents the number of weeks with the respective number of weekly tests. The yellow line represents the weekly tests vs. time. (B) Fraction of positive tests. Orange lines indicate the change in the death rate vs. the number of tests (left plot) and time (right plot). The histogram represents the number of weeks with the respective fraction of positive tests. The green line represents the fraction of positive tests vs. time.
Figure 9
Figure 9
Covariate impacts on the modeled fraction of cases requiring treatment in different wards (left) and fatality rates differentiated by ward (right) resulting from covariate changes over time in Germany.
Figure 10
Figure 10
ICU prediction on the district level, (A): Mean residuals of ICU predictions per 100,000 inhabitants per district (NUTS-3). (B): Mean residuals of ICU predictions per 100,000 inhabitants per government region (NUTS-2). (C): Mean residuals of ICU predictions in counties per 100,000 inhabitants in exemplary government region DEA3. (D): Observations and model predictions of ICU occupancy for the full exemplary government region DEA3 and its districts. Points indicate observations, and lines indicate model predictions. LK refers to “Landkreis” (rural district). SK refers to “Stadtkreis” (urban district).

References

    1. Wu F., Zhao S., Yu B., Chen Y.M., Wang W., Song Z.G., Hu Y., Tao Z.W., Tian J.H., Pei Y.Y., et al. A New Coronavirus Associated with Human Respiratory Disease in China. Nature. 2020;579:265–269. doi: 10.1038/s41586-020-2008-3. - DOI - PMC - PubMed
    1. World Health Organization Coronavirus Disease (COVID-19) Dashboard. [(accessed on 21 July 2022)]. Available online: https://covid19.who.int/
    1. Taylor L. COVID-19: Brazil’s Hospitals Close to Collapse as Cases Reach Record High. BMJ. 2021;372:n800. doi: 10.1136/bmj.n800. - DOI - PubMed
    1. Ellen Ehni C.M. ARD-DeutschlandTREND Januar 2021. [(accessed on 19 January 2021)]. Available online: https://www.tagesschau.de/inland/deutschlandtrend-2471.pdf.
    1. Cousins S. New Zealand Eliminates COVID-19. Lancet. 2020;395:1474. doi: 10.1016/S0140-6736(20)31097-7. - DOI - PMC - PubMed

Publication types

Supplementary concepts