. 2022 Sep 29;14(10):2146.
doi: 10.3390/v14102146.

Lessons from the Cerebrospinal Fluid Analysis of HTLV-1-Infected Individuals: Biomarkers of Inflammation for HAM/TSP Development

Affiliations

Lessons from the Cerebrospinal Fluid Analysis of HTLV-1-Infected Individuals: Biomarkers of Inflammation for HAM/TSP Development

Nicole Lardini Freitas et al. Viruses. .

Abstract

HTLV-1-associated myelopathy/tropical spastic paraparesis (HAM/TSP) is a neurodegenerative disease that leads to motor impairment due to a chronic inflammatory process in the central nervous system (CNS). However, the HAM/TSP pathogenesis is not completely clear, and biomarkers to define the disease prognosis are still necessary. Thus, we aimed to identify biomarkers for HAM/TSP and potential mechanisms involved in disease development. To that end, the concentrations of VILIP-1, BDNF, VEGF, β-NGF, TGF-β1, fractalkine/CX3CL1, IL-6, IL-18, and TNF-α, and the soluble forms of TREM-1, TREM-2, and RAGE, were assessed using a multiplex bead-based immunoassay in paired cerebrospinal fluid (CSF) and serum samples from HAM/TSP patients (n = 20), asymptomatic HTLV-1 carriers (AC) (n = 13), and HTLV-1-seronegative individuals (n = 9), with the results analyzed according to the speed of HAM/TSP progression. HAM/TSP patients had elevated fractalkine in the serum but not in the CSF, particularly those with low neuroinflammatory activity (CSF/serum ratio of neopterin <1 and of CXCL10 < 2). HAM/TSP patients with normal CSF levels of neurofilament light chain (NfL) showed elevated β-NGF in serum, and serum BDNF levels were increased in HTLV-1-infected individuals, particularly in HTLV-1 AC. Both HTLV-1 AC and HAM/TSP patients had lower TGF-β1 levels in CSF compared to uninfected individuals, and HAM/TSP patients with active CNS inflammation showed higher CSF levels of IL-18, which correlated with markers of inflammation, neuronal death, and blood−brain-barrier permeability. Although none of the factors evaluated were associated with the speed of HAM/TSP progression, reduced TGF-β1 levels in CSF suggest that suppressive responses to control subclinical and/or active neurodegeneration are impaired, while increased CSF IL-18 indicates the involvement of inflammasome-mediated mechanisms in HAM/TSP development.

Keywords: HAM/TSP; HTLV-1; IL-18; biomarkers; cerebrospinal fluid; inflammasome; neurodegeneration.


Conflict of interest statement

The authors declare no conflict of interest, and the funders had no role in the design of the study; in the collection, analyses, or interpretation of data; in the writing of the manuscript; or in the decision to publish the results.

Figures

Figure 1
Figure 1
Serum levels of common biomarkers of neuroinflammation. (A) VILIP-1, (B) sRAGE, (C) sTREM-1, (D) sTREM-2, (E) BDNF, (F) VEGF, (G) β-NGF, (H) IL-6, (I) IL-18, (J) TNF-α, (K) TGF-β1, and (L) CX3CL1 (fractalkine) levels were simultaneously determined with a multiplex bead-based immunoassay by flow cytometry in serum samples from asymptomatic HTLV-1 carriers (AC) (n = 13), HAM/TSP patients (n = 20), and a control group of HTLV-1-seronegative individuals (n = 5). A normal distribution was determined by the Kolmogorov–Smirnov test. The statistical analysis of parametric variables was performed with ANOVA and Bonferroni’s post-test, and non-parametric data were evaluated by the Kruskal–Wallis test and Dunn’s post-test. Results with a p-value < 0.05 were considered significant.
Figure 2
Figure 2
Correlation analysis of biomarkers of neuroinflammation in serum. (A) Correlation between TGF-β1, IL-18, BDNF, β-NGF, VEGF, sTREM-2, IL-6, sRAGE, TNF-α, CX3CL1 (Fractalkine), and sTREM-1 levels in serum samples from asymptomatic HTLV-1 carriers (AC) (n = 13) and HAM/TSP patients (n = 20) was performed with Spearman’s rank correlation test. (B) The analysis was also performed with the serum neopterin concentration and HTLV-1 proviral load (PVL) in PBMCs from HTLV-1 AC and HAM/TSP patients. Correlation coefficients are indicated by the color intensity, in which positive correlations are shown in red and negative correlations in blue. The size of the squares at intersections between factors represents the p-value, which is shown only for significant associations (p < 0.05).
Figure 3
Figure 3
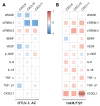
Correlation analysis between serum levels of inflammatory chemokines and factors associated with neuroinflammation. Correlation between serum levels of TGF-β1, IL-18, BDNF, β-NGF, VEGF, sTREM-2, IL-6, sRAGE, TNF-α, CX3CL1 (fractalkine), sTREM-1, and chemokines (CXCL9, CXCL10, and CXCL11) was evaluated in (A) asymptomatic HTLV-1 carriers (AC) (n = 13) and (B) HAM/TSP patients (n = 20) using the Spearman’s rank correlation test. Correlation coefficients are indicated by color intensity, in which positive correlations are shown in red and negative correlations in blue. The size of the squares at intersections between factors represents the p-value, which is shown only for significant associations (p < 0.05).
Figure 4
Figure 4
CSF levels of factors associated with neuroinflammation. (A) VILIP-1, (B) sRAGE, (C) sTREM-1, (D) sTREM-2, (E) BDNF, (F) VEGF, (G) β-NGF, (H) IL-6, (I) IL-18, (J) TNF-α, (K) TGF-β1, and (L) fractalkine (CX3CL1) levels were simultaneously determined with a multiplex bead-based immunoassay by flow cytometry in cerebrospinal fluid (CSF) samples from asymptomatic HTLV-1 carriers (AC) (n = 13), HAM/TSP patients (n = 20), and a control group of HTLV-1-seronegative individuals (n = 9). A normal distribution was determined by the Kolmogorov–Smirnov test. Statistical analysis of parametric variables was performed with ANOVA and Bonferroni’s post-test, and non-parametric data were evaluated by the Kruskal–Wallis test and Dunn’s post-test. Results with a p-value < 0.05 were considered significant.
Figure 5
Figure 5
Correlation analysis of CSF levels of factors associated with neuroinflammation. (A) Correlation between CSF levels of TGF-β1, IL-18, BDNF, VEGF, IL-6, sTREM-2, and sTREM-1 in samples from asymptomatic HTLV-1 carriers (AC) (n = 13) and HAM/TSP patients (n = 20) was performed with Spearman’s rank correlation test. (B) Correlation analysis was also performed with the CSF levels of neopterin, Tau protein, neurofilament light chain (NfL) and phosphorylated neurofilament heavy chain (pNfH) proteins, total proteins, and CSF cell counts from HTLV-1 AC and HAM/TSP patients. Correlation coefficients are indicated by color intensity, in which positive correlations are shown in red and negative correlations in blue. The size of the squares at intersections between factors represents the p-value, which is shown only for significant associations (p < 0.05).
Figure 6
Figure 6
Correlation between CSF levels of inflammatory chemokines and factors associated with neuroinflammation. Correlation between CSF levels of TGF-β1, IL-18, BDNF, VEGF, IL-6, sTREM-2, sTREM-1, and chemokines (CCL2, CCL3, CCL4, CCL17, CXCL5, CXCL10, and CXCL11) was evaluated in (A) asymptomatic HTLV-1 carriers (AC) (n = 13) and (B) HAM/TSP patients (n = 20) with Spearman’s rank correlation test. Correlation coefficients are indicated by color intensity, in which positive correlations are shown in red and negative correlations in blue. The size of the squares at intersections between factors represents the p-value, which is shown only for significant associations (p < 0.05).
Figure 7
Figure 7
Serum β-NGF and fractalkine/CX3CL1 levels, HTLV-1 proviral load, and CSF IL-18 concentration in HAM/TSP patients according to altered markers of inflammation and neurodegeneration. Individuals were separated according to normal (n = 7, purple) and altered (n = 13, red) CSF levels of neurofilament light (NfL) proteins and considering active neuroinflammation as a CSF/serum ratio of neopterin ≥1 (n = 13, red) or CXCL10 ≥ 2 (n = 9, red). Patients with a CSF/serum ratio of neopterin <1 (n = 7, purple) or CXCL10 < 2 (n = 11, purple) were considered to have low neuroinflammatory activity. Finally, individuals were also discriminated by normal CSF cell counts (<5 cells/mm3) (n = 12, purple) or pleocytosis (n = 8, red). (A) Serum β-NGF, (B) HTLV-1 proviral load (PVL), and (C,D) serum fractalkine/CX3CL1 levels were compared between groups with Student’s t-test. (E,F) CSF IL-18 levels were compared between groups with the Mann–Whitney test. Differences with p < 0.05 were considered significant.
Figure 8
Figure 8
Relative expression of factors associated with neuroinflammatory processes. The concentration of factors listed was determined in the (A) serum and (B) CSF of asymptomatic HTLV-1 carriers (AC) (n = 13) and HAM/TSP patients (n = 20), which were further characterized by the speed of disease progression as very slow (light blue), typical (dark blue), or rapid (green), as previously described [11]. Only factors with detectable levels in more than half of the samples were included in the analysis. Values were log2-transformed for heatmap analysis, and the expression normalized for each factor (lines). Reduced expression is represented by shades of blue, increased expression by shades of red, and the median is indicated by 0 (white).

References

    1. Gallo R.C. History of the Discoveries of the First Human Retroviruses: HTLV-1 and HTLV-2. Oncogene. 2005;24:5926–5930. doi: 10.1038/sj.onc.1208980. - DOI - PubMed
    1. Gessain A., Cassar O. Epidemiological Aspects and World Distribution of HTLV-1 Infection. Front. Microbiol. 2012;3:388. doi: 10.3389/fmicb.2012.00388. - DOI - PMC - PubMed
    1. Araujo A.Q.C., Silva M.T.T. The HTLV-1 Neurological Complex. Lancet Neurol. 2006;5:1068–1076. doi: 10.1016/S1474-4422(06)70628-7. - DOI - PubMed
    1. Bangham C.R.M., Araujo A., Yamano Y., Taylor G.P. HTLV-1-Associated Myelopathy/Tropical Spastic Paraparesis. Nat. Rev. Dis. Prim. 2015;1:15012. doi: 10.1038/nrdp.2015.12. - DOI - PubMed
    1. Osame M. Pathological Mechanisms of Human T-Cell Lymphotropic Virus Type I-Associated Myelopathy (HAM/TSP) J. Neurovirol. 2002;8:359–364. doi: 10.1080/13550280260422668. - DOI - PubMed

Publication types