. 2022 Sep 30;14(10):2180.
doi: 10.3390/v14102180.

Pin-Pointing the Key Hubs in the IFN-γ Pathway Responding to SARS-CoV-2 Infection

Affiliations

Pin-Pointing the Key Hubs in the IFN-γ Pathway Responding to SARS-CoV-2 Infection

Ayelen Toro et al. Viruses. .

Abstract

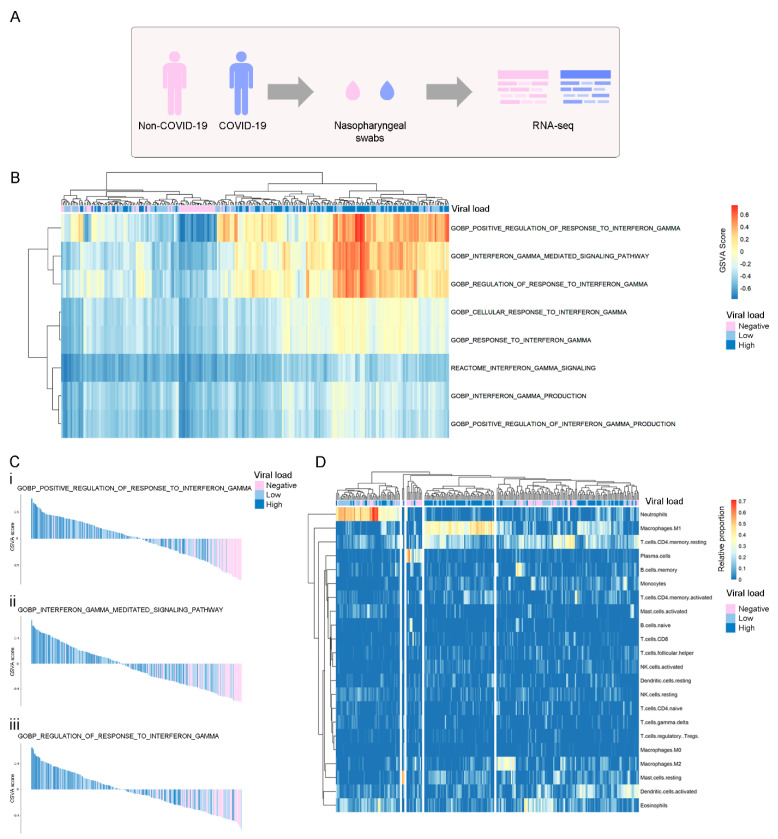
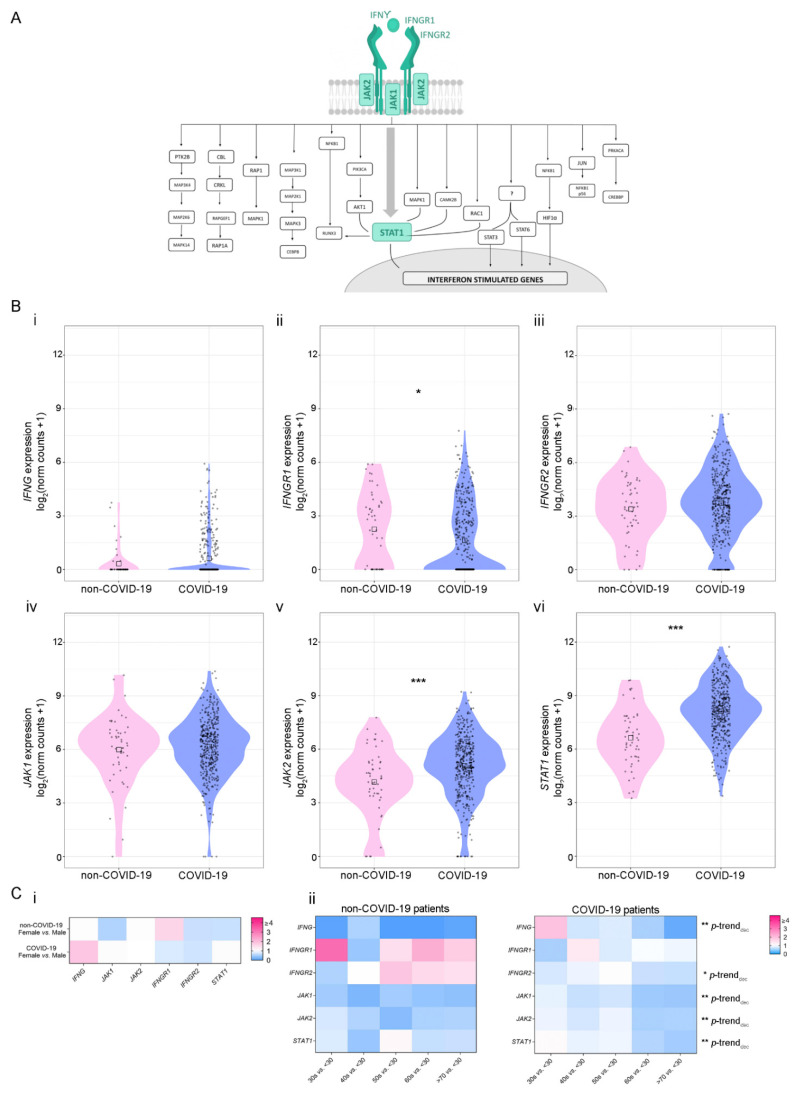
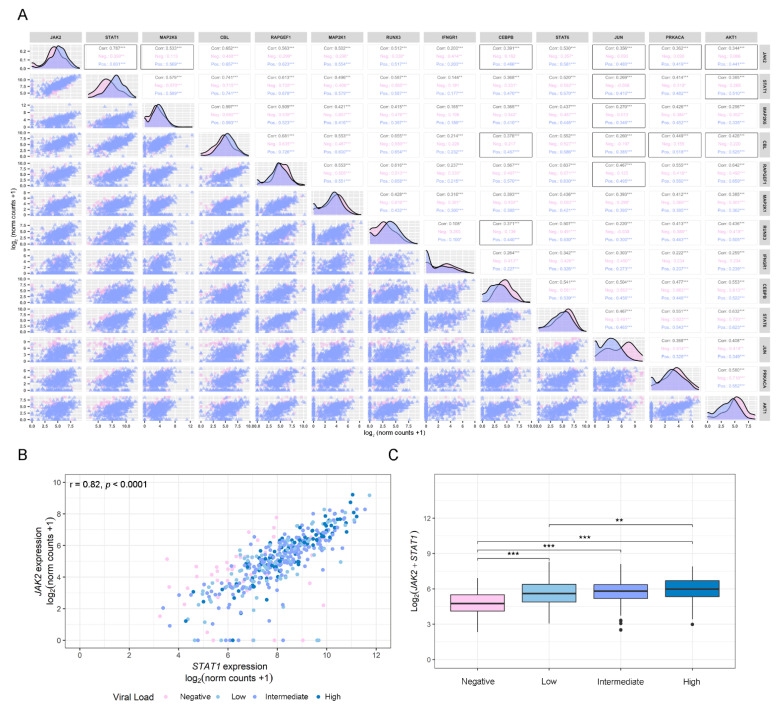
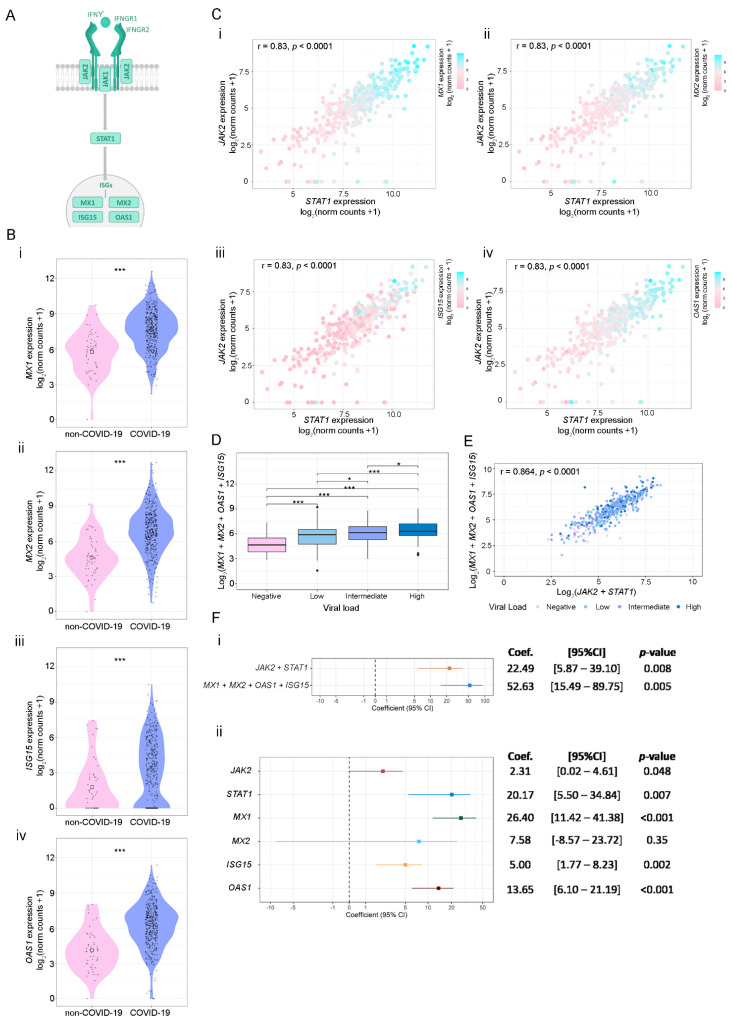
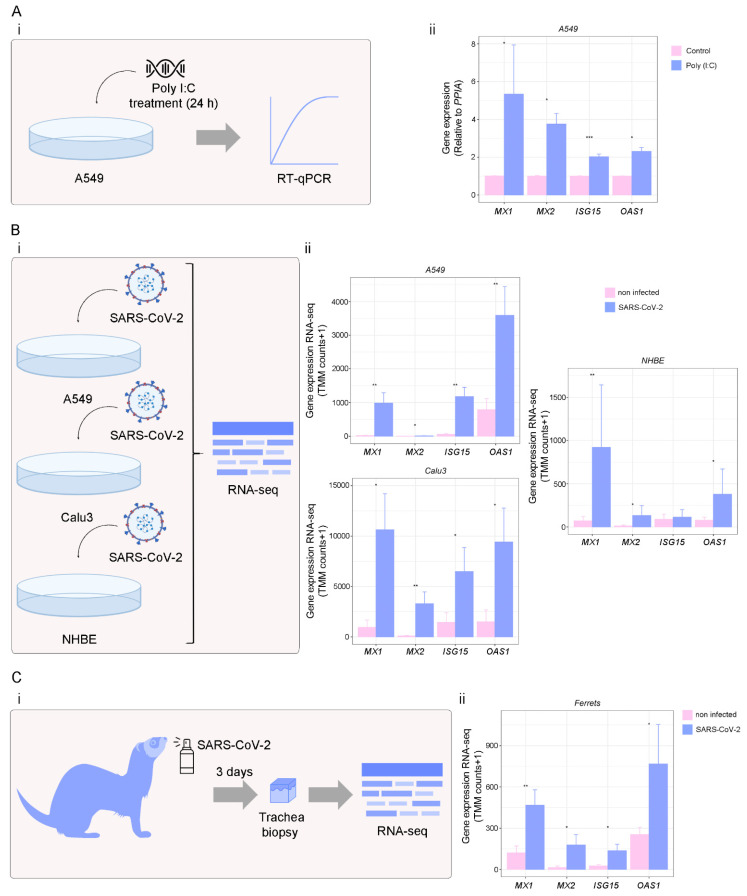
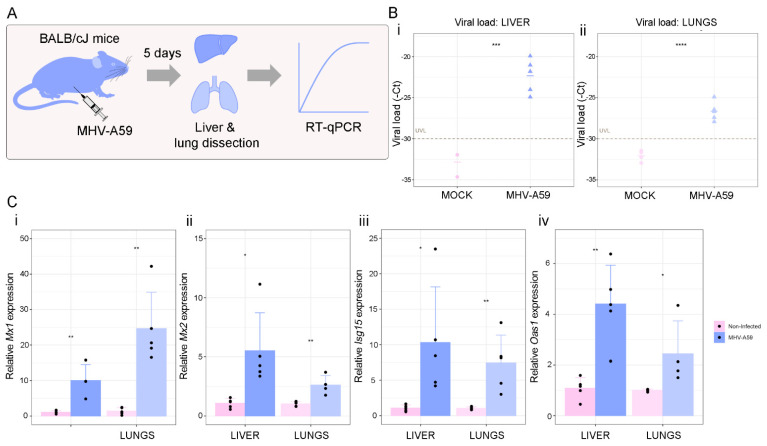
Interferon gamma (IFN-γ) may be potential adjuvant immunotherapy for COVID-19 patients. In this work, we assessed gene expression profiles associated with the IFN-γ pathway in response to SARS-CoV-2 infection. Employing a case-control study from SARS-CoV-2-positive and -negative patients, we identified IFN-γ-associated pathways to be enriched in positive patients. Bioinformatics analyses showed upregulation of MAP2K6, CBL, RUNX3, STAT1, and JAK2 in COVID-19-positive vs. -negative patients. A positive correlation was observed between STAT1/JAK2, which varied alongside the patient's viral load. Expression of MX1, MX2, ISG15, and OAS1 (four well-known IFN-stimulated genes (ISGs)) displayed upregulation in COVID-19-positive vs. -negative patients. Integrative analyses showcased higher levels of ISGs, which were associated with increased viral load and STAT1/JAK2 expression. Confirmation of ISGs up-regulation was performed in vitro using the A549 lung cell line treated with Poly (I:C), a synthetic analog of viral double-stranded RNA; and in different pulmonary human cell lines and ferret tracheal biopsies infected with SARS-CoV-2. A pre-clinical murine model of Coronavirus infection confirmed findings displaying increased ISGs in the liver and lungs from infected mice. Altogether, these results demonstrate the role of IFN-γ and ISGs in response to SARS-CoV-2 infection, highlighting alternative druggable targets that can boost the host response.

Keywords: COVID-19; IFN-γ; ISGs.


Conflict of interest statement

The authors declare no conflict of interest.

Figures

Figure 1
Figure 1
Global assessment at the transcriptional level of pathways and immune cell types related to IFN-γ production, signaling, and regulation of response in COVID-19-positive (light blue and blue) and -negative (pink) patients. (A) Experimental design of the GSE152075 dataset, composed of transcriptome data from nasopharyngeal swabs collected from 430 COVID-19 and 54 non-COVID-19 patients. (B) Non-supervised clustering of patients according to their GSVA score in each IFN-γ geneset. Higher GSVA scores indicate higher activity of the geneset at the RNA level. Each column is labeled according to the COVID-19 viral load of each patient (negative: pink, low: light blue, high: blue). (C) Waterfall plots of selected genesets that were highly activated in COVID-19 patients vs. non-COVID-19 patients. Patients are ordered from the highest to the lowest GSVA score in each geneset. (D) Unsupervised clustering of non-COVID-19 and COVID-19 patients according to the relative proportions of immune cell types estimated by CIBERSORT (LM22 signature) in RNA-seq data. Each column is labeled according to the COVID-19 viral load of each patient. Viral load is represented as a color scale and was categorized as Negative (pink), Low (first quartile; light blue), or High (fourth quartile; blue). COVID-19 patients with intermediate viral load were excluded from the analysis.
Figure 2
Figure 2
Expression of genes belonging to the canonical IFN-γ pathway in non-COVID-19 and COVID-19 patients. (A) Schematic representation of IFN-γ signaling pathway associated genes. The canonical IFN-γ pathway is represented in green. (B) Gene expression analysis (log2 (norm counts +1)) for (i) IFNG, (ii) IFNGR1, (iii) IFNGR2, (iv) JAK1, (v) JAK2, and (vi) STAT1 in COVID-19 (purple) vs. non-COVID-19 (pink) patients from the GSE152075 dataset, assessed by RNA-seq. p-values correspond to Wilcoxon rank-sum test. Black squares represent the median. (C) Heatmaps depicting the fold change (high = pink; low = blue) for gene expression of genes belonging to the canonical IFN-γ pathway considering sex (i) and age groups 30 s, 40 s, 50 s, 60 s, and 70 s vs. <30 (ii) in non-COVID-19 (left panel) and COVID-19 (right panel) patients from the GSE152075 dataset, assessed by RNA-seq. p-values correspond to decreasing Jonckheere–Terpstra trend test. Statistical significance * p < 0.05; ** p < 0.01; *** p < 0.001.
Figure 3
Figure 3
Correlation analysis. (A) Pairwise Spearman correlation matrix analysis between all genes of interest using the GSE152075 dataset. The upper half displays the Spearman coefficients (r) considering all patients (Corr.; black), non-COVID-19 patients (Neg.; pink), or COVID-19 patients (Pos.; purple). Black boxes highlight pairs of genes that have significant correlation only in COVID-19-positive patients, except for JAK2/STAT1, which was the pair with the highest coefficient in COVID-19-positive patients. The lower half displays the scatterplots. (B) Dot plot representing pairwise Spearman correlation for JAK2 and STAT1, considering viral load in COVID-19-positive patients from the GSE152075 dataset. Viral load is represented as a color scale and was categorized as Negative (pink), Low (first quartile; light blue), Intermediate (second and third quartile; purple), or High (fourth quartile; blue), and was considered as an independent variable expressed as cycle threshold (Ct) by RT-qPCR for the N1 viral gene at time of diagnosis. The interpretation for viral load is the lower the Ct, the higher the viral load. (C) Box plot representing the combined expression of JAK2 + STAT1 and their association with the viral load. Viral load was categorized as Negative (pink), Low (first quartile; light blue), Intermediate (second and third quartile; purple), or High (fourth quartile; blue). p-values correspond to Wilcoxon rank-sum test. Statistical significance * p < 0.05; ** p < 0.01; *** p < 0.001.
Figure 4
Figure 4
Association between STAT1, JAK1, and ISG’s expressions using the GSE152075 dataset. (A) Schematic representation of the canonical IFN-γ signaling pathway. (B) Gene expression analysis (log2 (norm counts +1)) for MX1 (i), MX2 (ii), ISG15 (iii), and OAS1 (iv) in COVID-19 (purple) vs. non-COVID-19 (pink) patients from the GSE152075 dataset, assessed by RNA-seq. p-values correspond to Wilcoxon rank-sum test. (C) Dot plots representing the pairwise Spearman correlation between STAT1 and JAK1, considering the expressions of MX1 (ii), MX2 (ii), ISG15 (iii), and OAS1 (iv) in COVID-19-positive patients. The independent variable is plotted on the x axis, and the dependent variable is plotted on the y axis. MX1, MX2, ISG15 and OAS1 expressions are represented as a color scale (purple = high; pink = low). (D) Box plot representing the combined expression of MX1 + MX2 + ISG15 + OAS1 and their association with the viral load. Viral load was categorized as Negative (pink), Low (first quartile; light blue), Intermediate (second and third quartile; purple), or High (fourth quartile; blue). p-values correspond to Wilcoxon rank-sum test. (E) Dot plot representing pairwise Spearman correlation between JAK2 + STAT1 and MX1 + MX2 + ISG15 + OAS1 combined expressions, considering viral load in COVID-19-positive patients from the GSE152075 dataset. Viral load is represented as a color scale and was categorized as Negative (pink), Low (first quartile; light blue), Intermediate (second and third quartile; purple), or High (fourth quartile; blue). (F) Forest plots representing the coefficient of the viral load as predictor variable in regression analyses (considering age and gender as covariables). (i) Model considering as response variable: combined expression of JAK2 + STAT1 or MX1 + MX2 + ISG15 + OAS1; and (ii) model considering response variable: individual expressions of JAK2, STAT1, MX1, MX2, ISG15 and OAS1. Coef.: Coefficient. CI: Confidence interval. Statistical significance * p < 0.05; ** p < 0.01; *** p < 0.001.
Figure 5
Figure 5
Analysis of ISGs expression in viral infections. (A) A549 cells were treated with Poly (I:C) for 24 h, and RNA was extracted for RT-qPCR analysis. (i) Schematic representation of the experimental design. (ii) MX1, MX2, ISG15, and OAS1 expressions assessed by RT-qPCR in A549 cells treated (purple) or not (pink) with Poly (I:C) (10 µg/ml; 24 h). Values were relativized using PPIA as a reference gene and normalized to the control. (B) MX1, MX2, ISG15, and OAS1 expressions (norm counts +1) in SARS-CoV-2-treated cells. (i) Schematic representation of the experimental design. (ii) MX1, MX2, ISG15, and OAS1 expressions in SARS-CoV-2-infected A549 (n = 6), Calu3 (n = 6), and NHBE (n = 10) cell lines (purple) (MOIs: 0.2, 2, and 2, respectively for 48 h) compared with mock (pink), assessed by RNA-seq, using the GSE147507 dataset. (C) MX1, MX2, ISG15, and OAS1 expressions (norm counts +1) in SARS-CoV-2-treated ferrets. (i) Schematic representation of the experimental design. (ii) MX1, MX2, ISG15, and OAS1 expressions in SARS-CoV-2-infected (5 × 10⁴ PFU) (purple) vs. mock-treated (pink) ferrets, assessed by RNA-seq in tracheal biopsy samples (n = 7), using the GSE147507 dataset. Samples were collected on day 3 after SARS-CoV-2 infection. Student’s t-test was performed to determine statistical differences. Statistical significance * p < 0.05; ** p < 0.01; *** p < 0.001.
Figure 6
Figure 6
Analysis of ISGs expression in a pre-clinical model of Coronavirus infection. (A) Schematic representation of the experimental design. BALB/cJ female mice (n = 10) were used for the in vivo experiments. Mice were randomly distributed into two experimental groups: non-infected (n = 5) and infected (n = 5) groups. Mice were infected with 6000 PFU of MHV-A59 by intraperitoneal injection of 100 µL of the virus diluted in sterile PBS. Five days after infection, mice were weighed and euthanized by cervical dislocation to dissect the liver and lung for RT-qPCR analyses. (B) Viral load was assessed by RT-qPCR in livers (i) and lungs (ii) of BALB/cJ mice infected (purple) or not (pink) with MHV-A59. Viral load is expressed as-cycle threshold (-Ct) by RT-qPCR for MHV. UVL: undetectable viral load. (C) Mx1 (i), Mx2 (ii), Isg15 (iii), and Oas1 (iv) expressions assessed by RT-qPCR in livers and lungs of BALB/cJ mice infected (purple) or not (pink) with MHV-A59. Values were relativized using Gapdh as a reference gene and normalized to the control. Student’s t-test was performed to determine statistical differences. Statistical significance * p < 0.05; ** p < 0.01; *** p < 0.001; **** p < 0.0001.

References

    1. Meo S.A., Alhowikan A.M., Al-Khlaiwi T., Meo I.M., Halepoto D.M., Iqbal M., Usmani A.M., Hajjar W., Ahmed N. Novel coronavirus 2019-nCoV: Prevalence, biological and clinical characteristics comparison with SARS-CoV and MERS-CoV. Eur. Rev. Med. Pharmacol. Sci. 2020;24:2012–2019. doi: 10.26355/eurrev_202002_20379. - DOI - PubMed
    1. Stanifer M.L., Guo C., Doldan P., Boulant S. Importance of Type I and III Interferons at Respiratory and Intestinal Barrier Surfaces. Front. Immunol. 2020;11:608645. doi: 10.3389/fimmu.2020.608645. - DOI - PMC - PubMed
    1. Palermo E., Di Carlo D., Sgarbanti M., Hiscott J. Type I Interferons in COVID-19 Pathogenesis. Biology. 2021;10:829. doi: 10.3390/biology10090829. - DOI - PMC - PubMed
    1. Chen D.-Y., Khan N., Close B.J., Goel R.K., Blum B., Tavares A.H., Kenney D., Conway H.L., Ewoldt J.K., Chitalia V.C., et al. SARS-CoV-2 Disrupts Proximal Elements in the JAK-STAT Pathway. J. Virol. 2021;95:e0086221. doi: 10.1128/JVI.00862-21. - DOI - PMC - PubMed
    1. Meffre E., Iwasaki A. Interferon deficiency can lead to severe COVID. Nature. 2020;587:374–376. doi: 10.1038/d41586-020-03070-1. - DOI - PubMed

Publication types