

This is a preprint.
It has not yet been peer reviewed by a journal.
The National Library of Medicine is
running a pilot
to include preprints that result from research funded by NIH in PMC and PubMed.
[Preprint]. 2022 Sep 17:2022.09.13.22279740.
doi: 10.1101/2022.09.13.22279740.
High co-circulation of influenza and SARS-CoV-2
Affiliations
- PMID: 36299425
- PMCID: PMC9603835
- DOI: 10.1101/2022.09.13.22279740
Item in Clipboard
High co-circulation of influenza and SARS-CoV-2
medRxiv.
.
Update in
-
High Co-circulation of Influenza and Severe Acute Respiratory Syndrome Coronavirus 2.Open Forum Infect Dis. 2022 Nov 28;9(12):ofac642. doi: 10.1093/ofid/ofac642. eCollection 2022 Dec. Open Forum Infect Dis. 2022. PMID: 36519125 Free PMC article.
Abstract
In the first two years of the COVID-19 pandemic, influenza transmission decreased substantially worldwide meaning that health systems were not faced with simultaneous respiratory epidemics. In 2022, however, substantial influenza transmission returned to Nicaragua where it co-circulated with SARS-CoV-2 causing substantial disease burden.
Conflict of interest statement
Figures
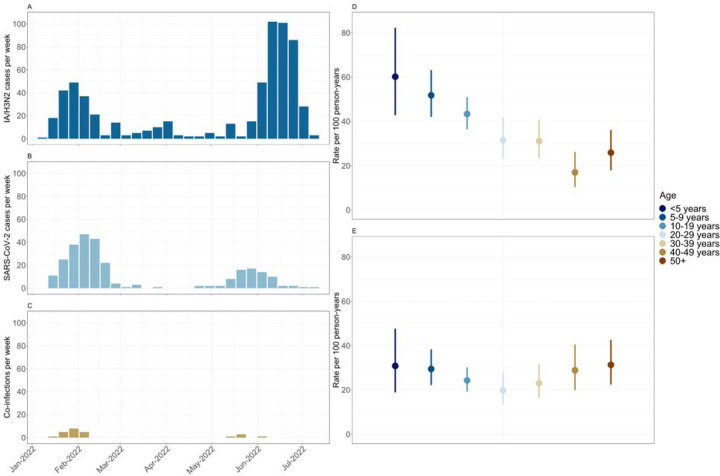
Panels A-C show the number of cases per week for influenza A/H3N2, SARS-CoV-2, and H3N2/SARS-CoV-2 co-infections respectively. Panels D and E show the incidence rate (per 100 person years) by age for influenza A/H3N2 and SARS-CoV-2 respectively.
References
-
- World Health Organization. Influenza Laboratory Surveillance Information - Virus detections by subtype reported to FluNet. Available at: https://www.who.int/tools/flunet. Accessed August 2, 2022.
-
- Centers for Disease Control and Prevention. Influenza (Flu) - Past Weekly Surveillance Reports. Available at: https://www.cdc.gov/flu/weekly/pastreports.htm. Accessed August 19, 2022.
-
- Australian Department of Health and Aged Care. Australian Influenza Surveillance Report and Activity Updates – 2022. Available at: https://www1.health.gov.au/internet/main/publishing.nsf/Content/cda-ozfl.... Accessed July 28, 2022.
-
- Centers for Disease Control and Prevention. Influenza (Flu) - Coverage by Season. Available at: https://www.cdc.gov/flu/fluvaxview/coverage-by-season.htm. Accessed August 19, 2022.
-
- Centers for Disease Control and Prevention. Weekly Flu Vaccination Dashboard - Data Summary for the 2021–22 Flu Season. Available at: https://www.cdc.gov/flu/fluvaxview/dashboard/vaccination-dashboard.html. Accessed 9/7/2022.
Publication types
LinkOut - more resources
Full Text Sources
Miscellaneous