. 2022 Oct 10:13:1014264.
doi: 10.3389/fgene.2022.1014264. eCollection 2022.

Construction of an immune-related signature for predicting the ischemic events in patients undergoing carotid endarterectomy

Affiliations

Construction of an immune-related signature for predicting the ischemic events in patients undergoing carotid endarterectomy

Shifu Li et al. Front Genet. .

Erratum in

Abstract

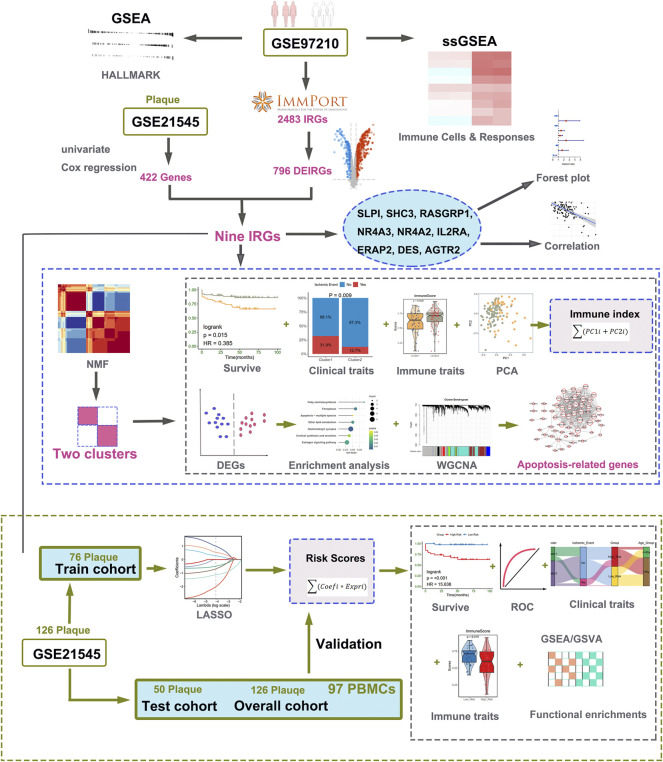
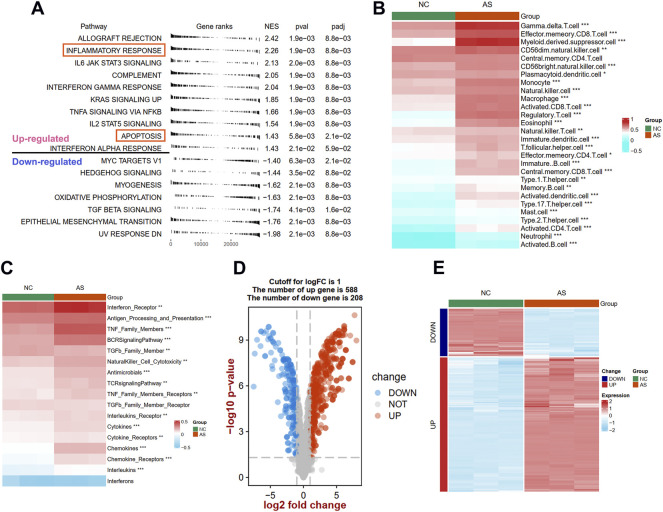
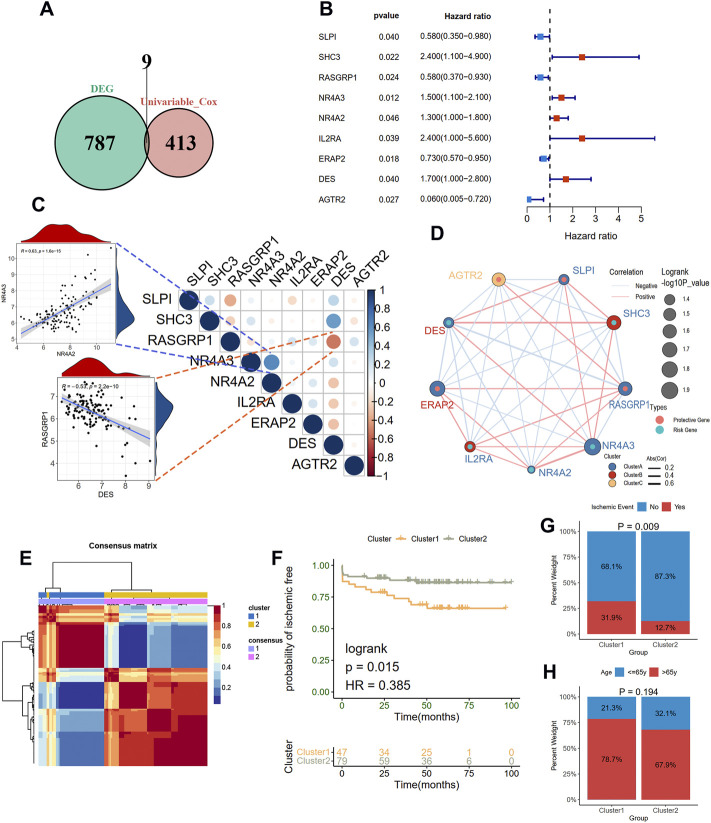
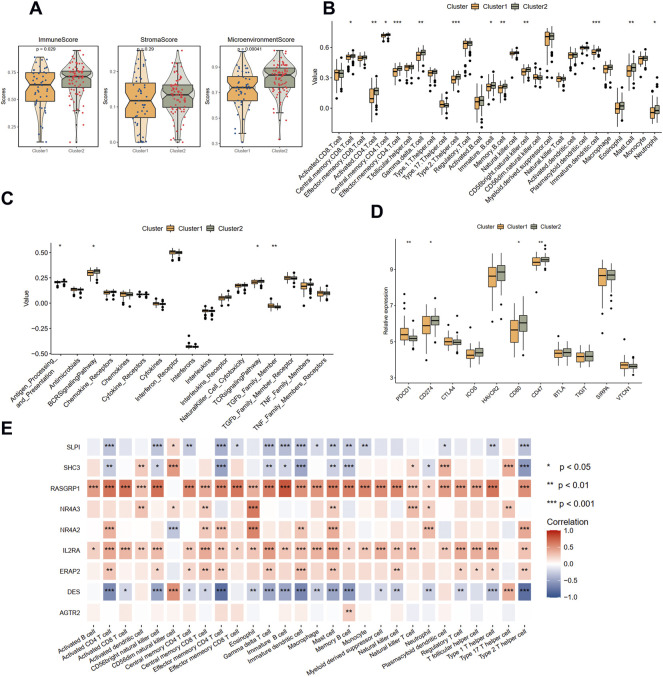
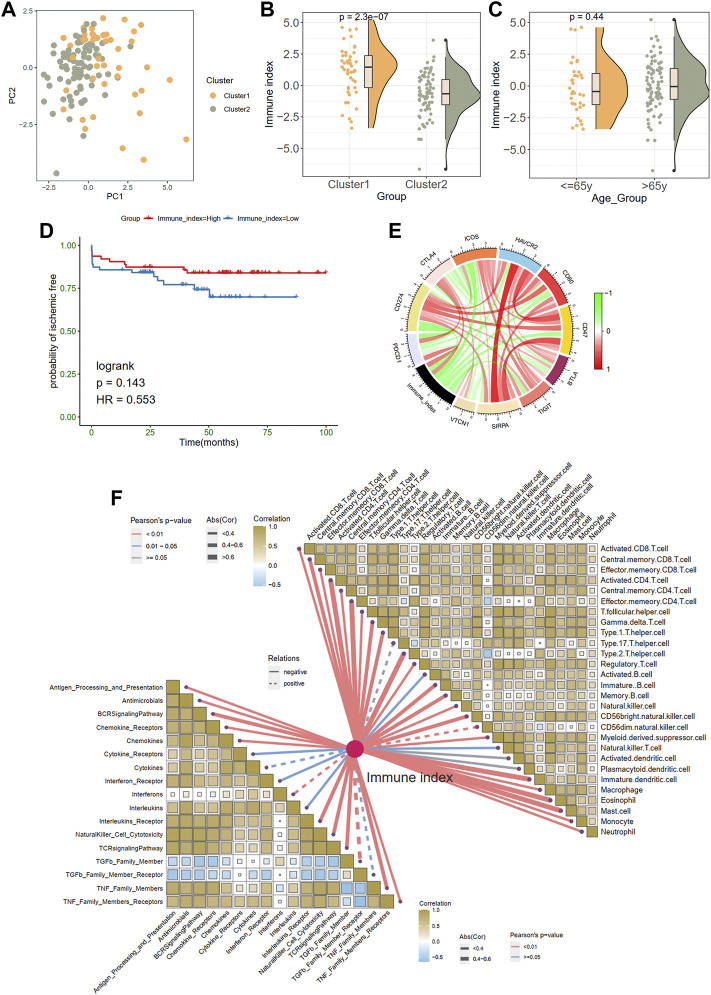
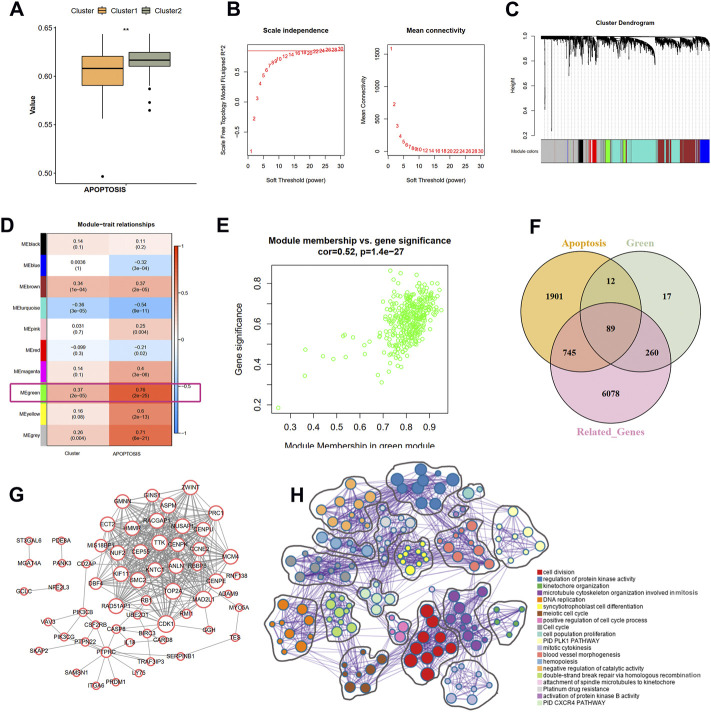
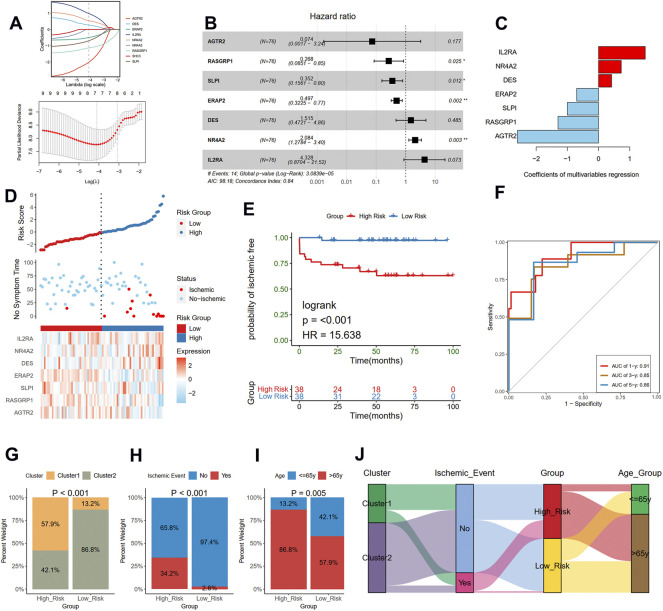
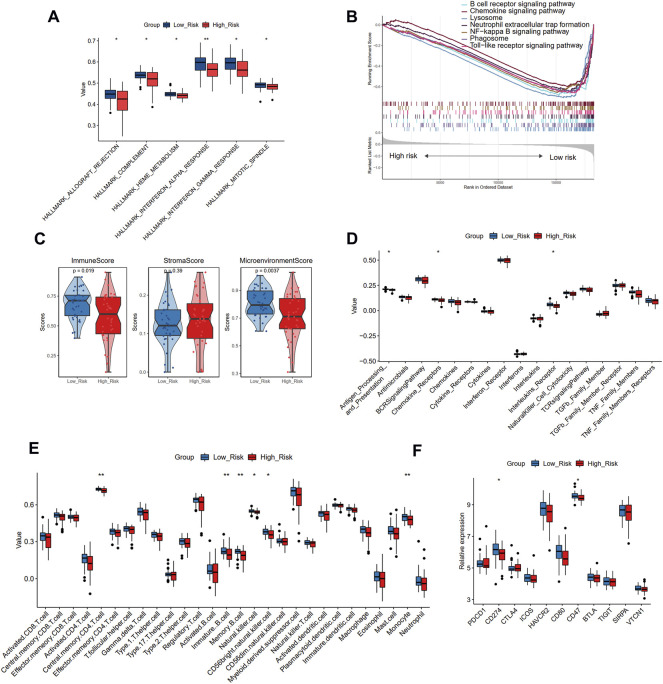
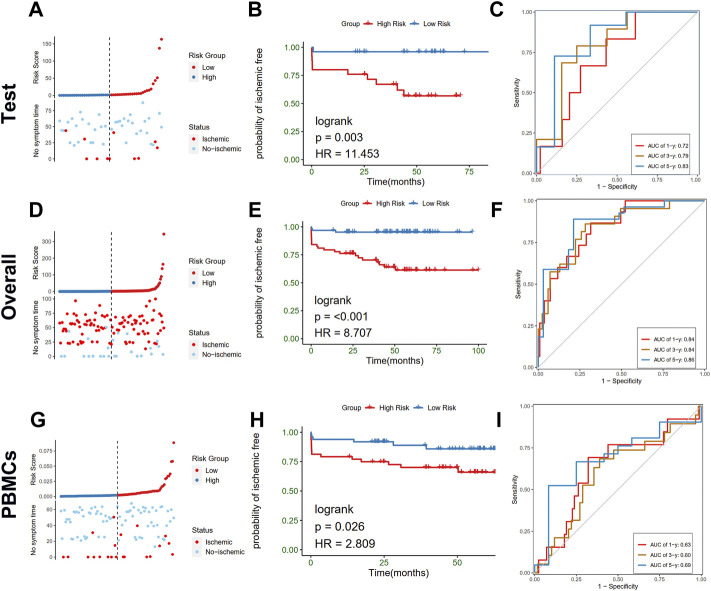
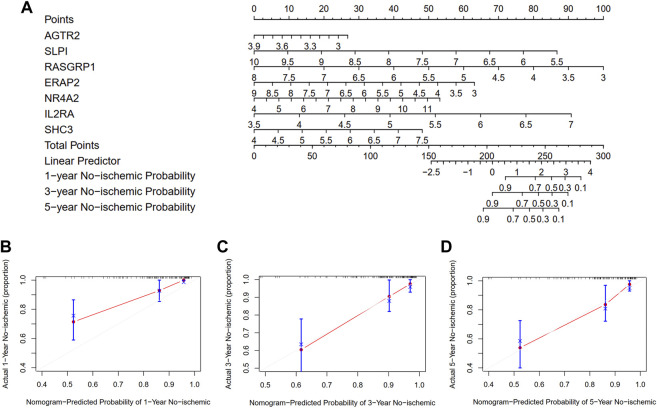
Background: Inflammatory responses have drawn more attention to atherosclerosis; however, the immune-related genes (IRGs) as a prognostic factor in atherosclerotic plaque remain to be fully elucidated. Here, the purpose of this study was to investigate whether the IRGs could be identified as a reliable biomarker for predicting ischemic events in patients undergoing carotid endarterectomy (CEA). Methods: Two datasets GSE97210 and GSE21545 were downloaded from the Gene Expression Omnibus (GEO) database. The dataset GSE97210 was used to explore the significant pathways and differentially expressed IRGs (DEIRGs) between plaques and controls, which were further screened to identify the prognostic DEIRGs in the GSE21545 dataset. The identification of molecular subgroups with the prognostic gene expression patterns was achieved through nonnegative matrix factorization (NMF) clustering. Functional analyses including GO, KEGG, GSVA, and GSEA analyses, and immune analyses including xCell and ssGSEA algorithms were conducted to elucidate the underlying mechanisms. The prognostic risk model was constructed using the LASSO algorithm and multivariate Cox regression analysis. Results: A total of 796 DEIRGs (including 588 upregulated and 208 downregulated) were identified. Nine prognostic DEIRGs were further screened with univariate Cox regression analysis. Two clusters with different prognosis were grouped based on the prognostic DEIRGs. Immune infiltration analysis shows that cluster 2 with a better prognosis presented with a higher immune response than cluster 1. A prognostic model based on seven IRGs (IL2RA, NR4A2, DES, ERAP2, SLPI, RASGRP1, and AGTR2) was developed and verified. Consistent with the immune analysis of the cluster, the immune infiltration in the low-risk group with a better prognosis was also more active than that in the high-risk group. Finally, a nomogram based on the seven genes was constructed, which might have future implications in clinical care. Conclusion: The expression of immune-related genes is correlated with the immune microenvironment of atherosclerotic patients and could be applied to predict the ischemic events in patients undergoing CEA accurately.

Keywords: atherosclerosis; immune infiltration; immune-related genes; ischemic events; molecular subtypes.


Conflict of interest statement

The authors declare that the research was conducted in the absence of any commercial or financial relationships that could be construed as a potential conflict of interest.

Figures

FIGURE 1
FIGURE 1
Workflow of data analysis in our present work. DEGs, differentially expressed genes; IRGs, immune-related genes; DEIRGs, differentially expressed immune-related genes; GSEA, gene set enrichment analysis; ssGSEA, single sample gene set enrichment analysis; GSVA, gene set variation analysis; NMF, Non-negative Matrix Factorization; PCA, principal component analysis; ROC, receiver operating characteristic curve; GO, Gene Ontology; KEGG, Kyoto Encyclopedia of Genes and Genomes; LASSO, least absolute shrinkage, and selection operator; WGCNA, weighted gene co-expression network analysis.
FIGURE 2
FIGURE 2
Identification of different function pathways, immune infiltration, and DEIRGs in plaque compared with the normal arterial tissues. (A) Up and downregulated hallmark pathways between plaque and controls in GSEA analysis. The difference of immune cell (B) and immune responses (C) between plaque and controls in ssGSEA analysis. A volcano plot (D) and heat map (E) shows the differentially expressed immune-related genes (DEIRGs) between plaque and controls. Significance level was denoted by *p value < 0.05, **p value < 0.01, ***p value < 0.001.
FIGURE 3
FIGURE 3
Clustering two molecular subgroups through nonnegative matrix factorization (NMF) method. (A) Screening nine prognostic DEIRGs by overlapping the DEIRGs and prognostic genes with univariate Cox regression analysis. (B) A forest plot showing the hazard ratio of nine prognostic DEIRGs. (C) and (D) indicating the expression correlations of the nine prognostic DEIRGs. The enlarged panels show the most positive and negative correlation. (E) Identification of two clusters with the optimal value for consensus clustering. (F) Survive analysis of two distinct clusters. A histogram shows the proportion of the occurrence of an ischemic event (G) and age group (H) in two clusters.
FIGURE 4
FIGURE 4
Immune landscapes between two different immune-related clusters. (A) The comparison of the immune score, stromal score, and microenvironment score in two clusters with xCell analysis. (B) The comparison of 28 immune cells in two clusters with ssGSEA analysis. (C) The comparison of 17 immune responses in two clusters with ssGSEA analysis. (D) The expression levels of immune checkpoint genes in two clusters. (E) The correlations between immune cells and nine immune-related genes. Significance level was denoted by *p value < 0.05, **p value < 0.01, ***p value < 0.001.
FIGURE 5
FIGURE 5
Generation of immune index. (A) Principal component analysis. (B) The comparison of an immune index between two clusters. (C) The comparison of an immune index between different age groups. (D) Survive analysis of high- and low-immune index. (E) The relationships between the immune index and immune checkpoint genes. Green indicates the negative relations and red represents the positive relations. (F) The relationships between the immune index with the immune cells and responses.
FIGURE 6
FIGURE 6
Identification of the correlation of apoptosis-related genes and nine IRGs. (A) The difference scores of apoptosis process between two clusters with GSVA analysis. (B) Correlation between soft threshold power and scale-free topology model with WGCNA analysis. (C) Cluster tree of coexpression modules with WGCNA analysis. Different colors represent different modules. (D) The module-trait relationships with WGCNA analysis. (E) Screening the green module as the key module. (F) Intersecting the apoptosis-related genes correlated with nine IRGs. Apoptosis indicates the apoptosis-related genes in MSigDB database. Green means the green module genes in WGCNA analysis. Related-genes mean those genes correlated with nine IRGs in GSE21545 dataset. (G) Protein-protein network of apoptosis-related genes. (H) The biological function of apoptosis-related genes. Different colors indicate different pathways.
FIGURE 7
FIGURE 7
Construction of a risk model in the training cohort. (A) Feature selection by LASSO regression (down) and the coefficients change of different genes with different lambda (up). (B) Multivariate Cox regression depicted with a forest plot. (C) The coefficients of selected seven genes in multivariate Cox regression. (D) Distribution of risk score (up) and ischemic status (middle) of atherosclerotic patients in the high and low-risk groups, and heat map (down) illustrating the expression patterns of the seven model genes in the two groups. (E) Survival curve of the atherosclerotic patients in the two groups. (F) Time-dependent ROC curve of the risk model. A histogram shows the relative proportion of different clusters (G), ischemic event (H), and age group (I) in two risk groups. (J) A Sankey diagram showing the distribution of different groups.
FIGURE 8
FIGURE 8
The different biological pathways and immune microenvironment between high- and low-risk groups. (A) The significant different hallmark pathways in two groups with GSVA analysis. (B) The enrichment of KEGG pathways in two groups with GSEA analysis. (C) The comparison of the immune score, stromal score, and microenvironment score in two groups with xCell analysis. (D) The comparison of 17 immune responses in two groups with ssGSEA analysis. (E)The comparison of 28 immune cells in two groups with ssGSEA analysis. (F) The expression levels of immune checkpoint genes in two risk groups. Significance level was denoted by *p value < 0.05, **p value < 0.01, ***p value < 0.001.
FIGURE 9
FIGURE 9
Validation of the risk model in test, overall, and PBMCs cohort. (A–C) Distribution of risk score (up) and ischemic status (down) of atherosclerotic patients, survival curve, time-dependent ROC curve of the risk model of the atherosclerotic patients in the high and low-risk groups in test cohort, respectively. (D–F) Distribution of risk score (up) and ischemic status (down) of atherosclerotic patients, survival curve, time-dependent ROC curve of the risk model of the atherosclerotic patients in the high and low-risk groups in the overall cohort, respectively. (G–I) Distribution of risk score (up) and ischemic status (down) of atherosclerotic patients, survival curve, time-dependent ROC curve of the risk model of the atherosclerotic patients in the high and low-risk groups in PBMCs cohort, respectively.
FIGURE 10
FIGURE 10
Development and evaluation of the nomogram to predict the ischemic event for patients with atherosclerosis undergoing CEA. (A) A combination of seven genes’ expressions was used to construct a nomogram for predicting the 1-, 3-, and 5-year event-free probability. (B–D) Calibration curves demonstrate that the nomogram-predicted event-free probabilities correspond closely to the observed probabilities for 1-, 3-, and 5-year in patients with atherosclerotic plaque, respectively.

Similar articles

Cited by

References

    1. Aran D., Hu Z., Butte A. J. (2017). xCell: digitally portraying the tissue cellular heterogeneity landscape. Genome Biol. 18, 220. 10.1186/s13059-017-1349-1 - DOI - PMC - PubMed
    1. Bai H. L., Lu Z. F., Zhao J. J., Ma X., Li X. H., Xu H., et al. (2019). Microarray profiling analysis and validation of novel long noncoding RNAs and mRNAs as potential biomarkers and their functions in atherosclerosis. Physiol. Genomics 51, 644–656. 10.1152/physiolgenomics.00077.2019 - DOI - PMC - PubMed
    1. Bakhshi H., Varadarajan V., Ambale-Venkatesh B., Meyghani Z., Ostovaneh M. R., Durda P., et al. (2020). Association of soluble interleukin-2 receptor α and tumour necrosis factor receptor 1 with heart failure: The Multi-Ethnic Study of Atherosclerosis. Esc. Heart Fail. 7, 639–644. 10.1002/ehf2.12623 - DOI - PMC - PubMed
    1. Bhattacharya S., Andorf S., Gomes L., Dunn P., Schaefer H., Pontius J., et al. (2014). ImmPort: Disseminating data to the public for the future of immunology. Immunol. Res. 58, 234–239. 10.1007/s12026-014-8516-1 - DOI - PubMed
    1. Bonati L. H., Jansen O., de Borst G. J., Brown M. M. (2022). Management of atherosclerotic extracranial carotid artery stenosis. Lancet. Neurol. 21, 273–283. 10.1016/s1474-4422(21)00359-8 - DOI - PubMed

LinkOut - more resources