. 2022 Oct 4;25(11):105276.
doi: 10.1016/j.isci.2022.105276. eCollection 2022 Nov 18.

Integrative genomic analysis facilitates precision strategies for glioblastoma treatment

Affiliations

Integrative genomic analysis facilitates precision strategies for glioblastoma treatment

Danyang Chen et al. iScience. .

Abstract

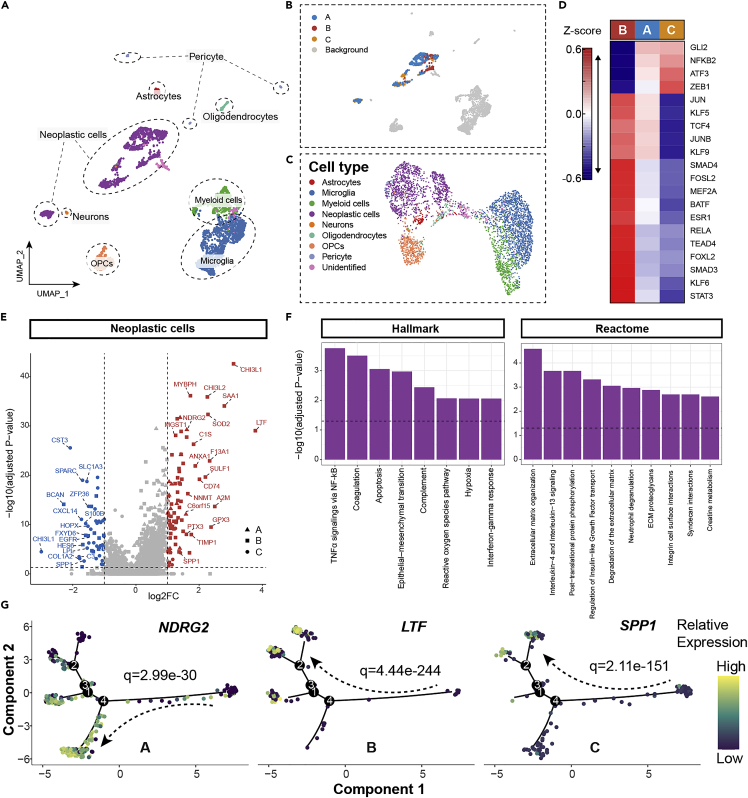
Glioblastoma (GBM) is the most common form of malignant primary brain tumor with a dismal prognosis. Currently, the standard treatments for GBM rarely achieve satisfactory results, which means that current treatments are not individualized and precise enough. In this study, a multiomics-based GBM classification was established and three subclasses (GPA, GPB, and GPC) were identified, which have different molecular features both in bulk samples and at single-cell resolution. A robust GBM poor prognostic signature (GPS) score model was then developed using machine learning method, manifesting an excellent ability to predict the survival of GBM. NVP-BEZ235, GDC-0980, dasatinib and XL765 were ultimately identified to have subclass-specific efficacy targeting patients with a high risk of poor prognosis. Furthermore, the GBM classification and GPS score model could be considered as potential biomarkers for immunotherapy response. In summary, an integrative genomic analysis was conducted to advance individual-based therapies in GBM.

Keywords: Artificial intelligence; Cancer; Cancer systems biology; Omics.


Conflict of interest statement

The authors declare no conflict of interest.

Figures

None
Graphical abstract
Figure 1
Figure 1
Overview of the study design Schematic depicting included datasets, discovery of novel classification, construction of prognostic model and corresponding precision treatment strategies in glioblastoma.
Figure 2
Figure 2
The molecular, mutational and prognostic characteristics of novel classification (A) An overview of clinical phenotype, somatic mutation and CNV characteristics across three subclasses. Composite GISTIC amplification (B) and deletion (C) profiles for GPA, GPB and GPC with annotations highlighting differences. The survival analysis among three subclasses in the TCGA training cohort (PFI and OS) (D), the TCGA testing cohort (OS) and the CGGA cohort (OS) (E). CNV, Copy Number Variation; PFI, Progression-free interval; OS, Overall survival; GISTIC, Genomic Identification of Significant Targets in Cancer; MGMT: O (6)-methylguanine-DNA methyltransferase; G-CIMP, Glioma CpG island methylator phenotype; IDH1, Isocitrate dehydrogenase enzyme 1.
Figure 3
Figure 3
Single-cell transcriptomic characteristics of three GBM subclasses (A) UMAP plot of scRNA-seq data from four patients. (B) Cellular maps of subclasses-associated neoplastic cell subpopulations by Scissor displayed by UMAP dimension reduction. (C) Visualization of single-cell data based on overall TF activities of each cell. (D) Heatmap of top 20 highly variable TF activities among GPA, GPB and GPC cells. The color of heatmap representing z-scores of TF activities. (E) Volcano plot of differentially expressed genes among GPA, GPB and GPC cells. The two vertical dashed lines indicate ±1-fold change in gene expression, and the horizontal dashed line demonstrates an FDR cutoff of 0.05. The FDR was the adjusted p value calculated by the two-tailed Wilcoxon rank-sum test. (F) Enrichment bar plot of differentially expressed genes in GPB cells versus GPC cells based on Reactome and Hallmark pathways. The vertical dashed line denotes an FDR cutoff of 0.05. (G) Transcriptional changes of NDRG2, LTF and SPP1 along pseudotime. A, GPA cells; B, GPB cells; C, GPC cells; TF, Transcription factor.
Figure 4
Figure 4
Estimation of prognostic value of 36-gene GPS (A–C) Time-dependent receiver operating characteristic (tROC) curves comparing GPS and four public signatures in the TCGA training cohort (OS and PFI) (A), the TCGA testing cohort (PFI) (B) and the GSE13041 cohort (OS) (C). (D) ROC curves of the performance of diverse prognostic signatures in the GSE108474 cohort at 3 and 5 years. (E) The calibration plots for the comparison of GPS model with ideal model at 3 and 5 years. (F) Results of the univariate and multivariate Cox regression analysis in the TCGA cohort, the CGGA cohort, the GSE13041 cohort and the GSE108474 cohort. PFI, Progression-free interval; OS, Overall survival.
Figure 5
Figure 5
Identification of GPS-associated drug targets and therapeutic agents (A) Volcano plot of Spearman’s correlations and significance between GPS scores and gene expression of drug targets (left). Red dots indicate the significant positive correlations. Volcano plot of Spearman’s correlations and significance between GPS and CERES score of drug targets (mid) as well as between GPS and DEMETER score of drug targets (right) separately. Blue dots indicate the significant positive correlations. (B) Summary of the most potential therapeutic agents for patients from three subclasses with high risk of poor prognosis according to the evidence from multiple sources. Dose-response curves to 48 h (C) and colony formation assay (D) of NVP-BEZ235, GDC−0980, Dasatinib and XL765 treatment in glioblastoma cell lines of GPA, GPB, and GPC subclasses. Error bars indicate the SEM.
Figure 6
Figure 6
The immune landscape and immunotherapeutic responses among three subclasses (A) An overview of the GPS score, immune cells, checkpoint targets and cytokines in three subclasses. (B) The stacked column charts of immune cell fraction in GPA, GPB and GPC. (C) The boxplots depicting difference of BMDM and MG enrichment score among three subclasses. (D) The scatterplot of M1 and M2 phenotypes from BMDM and MG based on scRNA-seq data. (E) Violin plot showing the enrichment scores of immunosuppressive expression signatures, including PTEN pathway, induced regulatory T cells, and FOXO3 proteins. BMDM, Bone marrow-derived macrophage; MG, Microglia; ANOVA was used to compare groups. ∗: p < 0.05, ∗∗: p < 0.01, ∗∗∗: p < 0.001, ∗∗∗∗: p < 0.0001, NS, Not Significant.

References

    1. Abdelfattah N., Kumar P., Wang C., Leu J.S., Flynn W.F., Gao R., Baskin D.S., Pichumani K., Ijare O.B., Wood S.L., et al. Single-cell analysis of human glioma and immune cells identifies S100A4 as an immunotherapy target. Nat. Commun. 2022;13:767. doi: 10.1038/s41467-022-28372-y. - DOI - PMC - PubMed
    1. Ahluwalia M.S., de Groot J., Liu W.M., Gladson C.L. Targeting SRC in glioblastoma tumors and brain metastases: rationale and preclinical studies. Cancer Lett. 2010;298:139–149. doi: 10.1016/j.canlet.2010.08.014. - DOI - PMC - PubMed
    1. Alhalabi O.T., Fletcher M.N.C., Hielscher T., Kessler T., Lokumcu T., Baumgartner U., Wittmann E., Schlue S., Göttmann M., Rahman S., et al. A novel patient stratification strategy to enhance the therapeutic efficacy of dasatinib in glioblastoma. Neuro Oncol. 2021;24:39–51. doi: 10.1093/neuonc/noab158. - DOI - PMC - PubMed
    1. Alvarez M.J., Shen Y., Giorgi F.M., Lachmann A., Ding B.B., Ye B.H., Califano A. Functional characterization of somatic mutations in cancer using network-based inference of protein activity. Nat. Genet. 2016;48:838–847. doi: 10.1038/ng.3593. - DOI - PMC - PubMed
    1. Ayers M., Lunceford J., Nebozhyn M., Murphy E., Loboda A., Kaufman D.R., Albright A., Cheng J.D., Kang S.P., Shankaran V., et al. IFN-gamma-related mRNA profile predicts clinical response to PD-1 blockade. J. Clin. Invest. 2017;127:2930–2940. doi: 10.1172/JCI91190. - DOI - PMC - PubMed

LinkOut - more resources