. 2022 Oct 4;25(11):105275.
doi: 10.1016/j.isci.2022.105275. eCollection 2022 Nov 18.

A novel NF2 splicing mutant causes neurofibromatosis type 2 via liquid-liquid phase separation with large tumor suppressor and Hippo pathway

Affiliations

A novel NF2 splicing mutant causes neurofibromatosis type 2 via liquid-liquid phase separation with large tumor suppressor and Hippo pathway

Zexiao Jia et al. iScience. .

Abstract

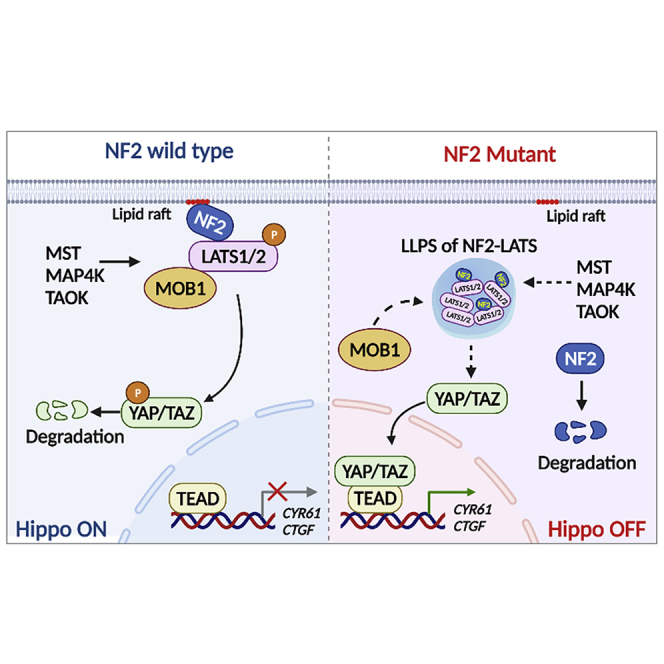
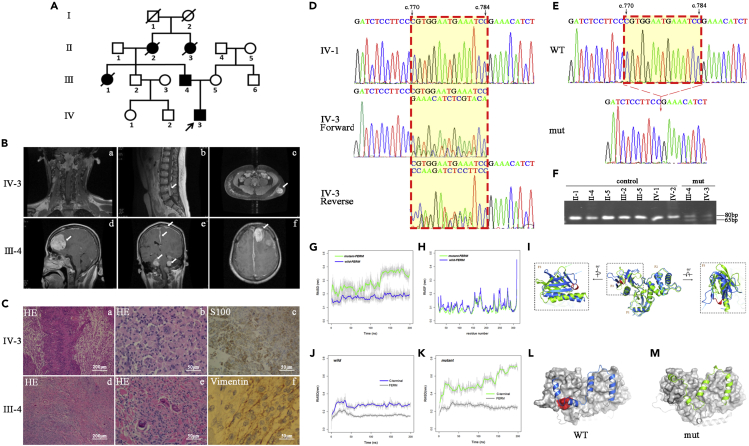
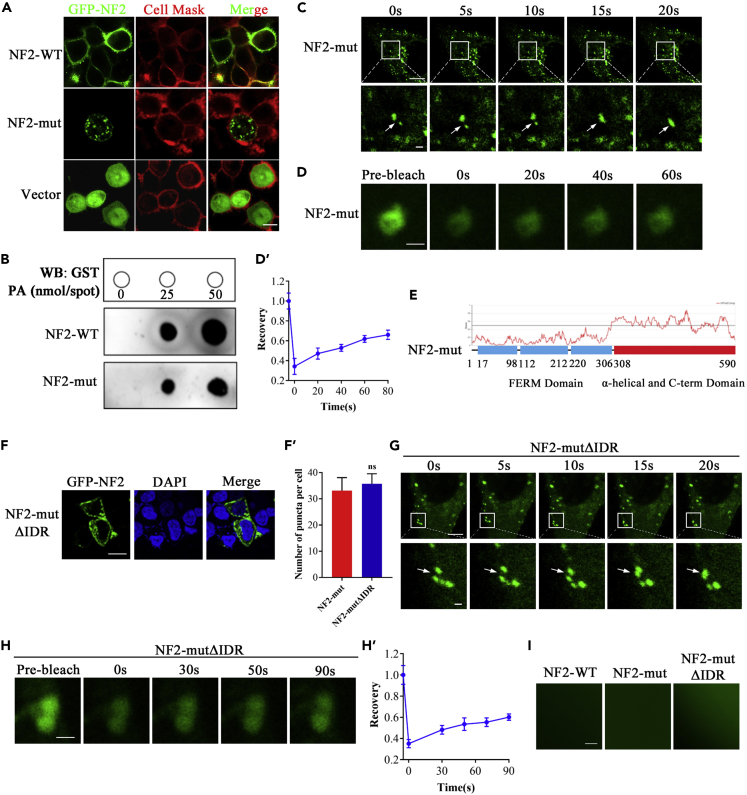
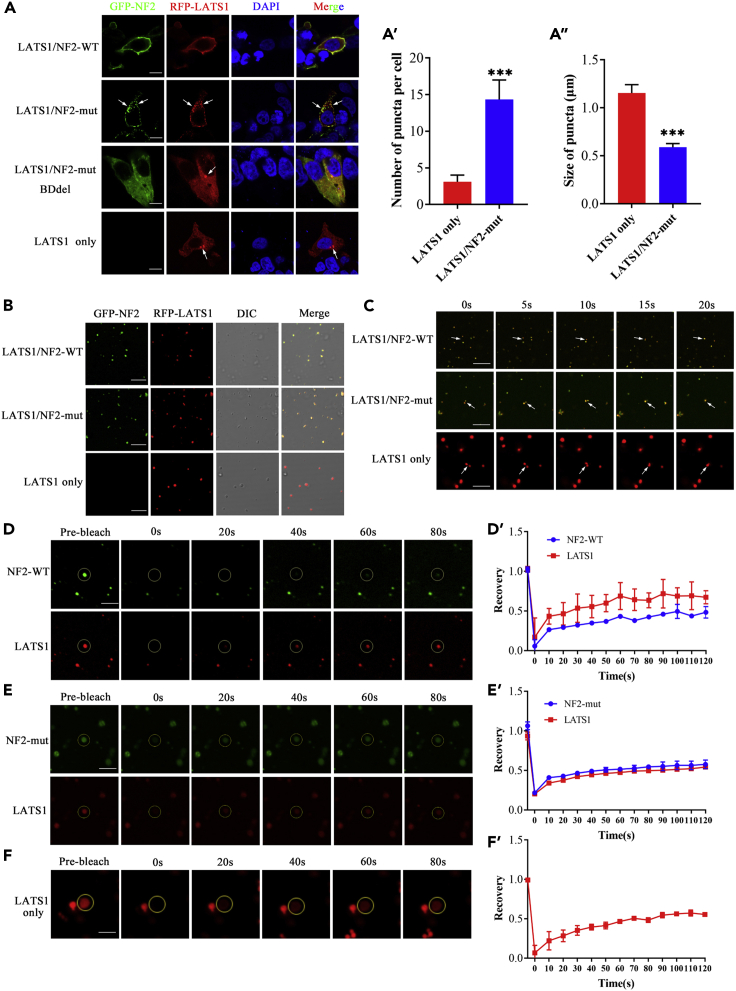
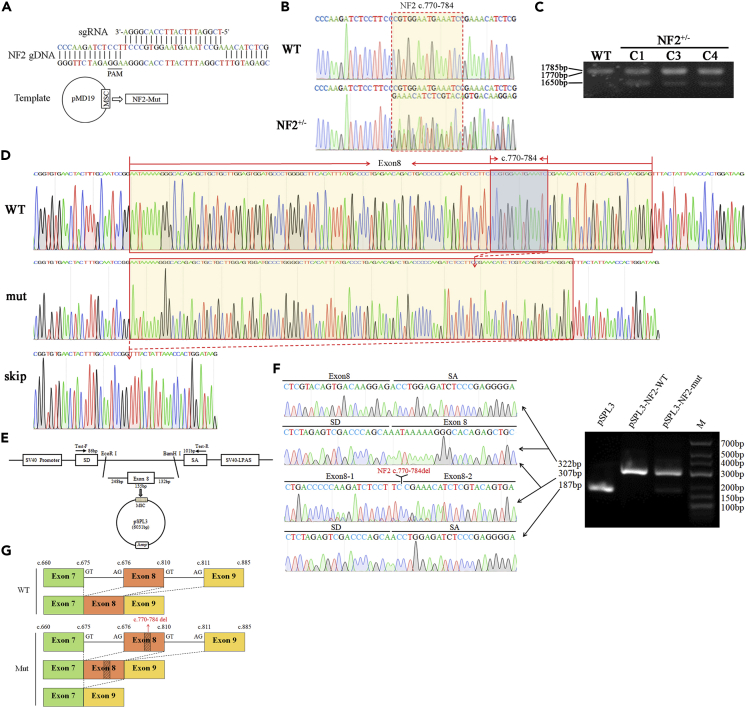
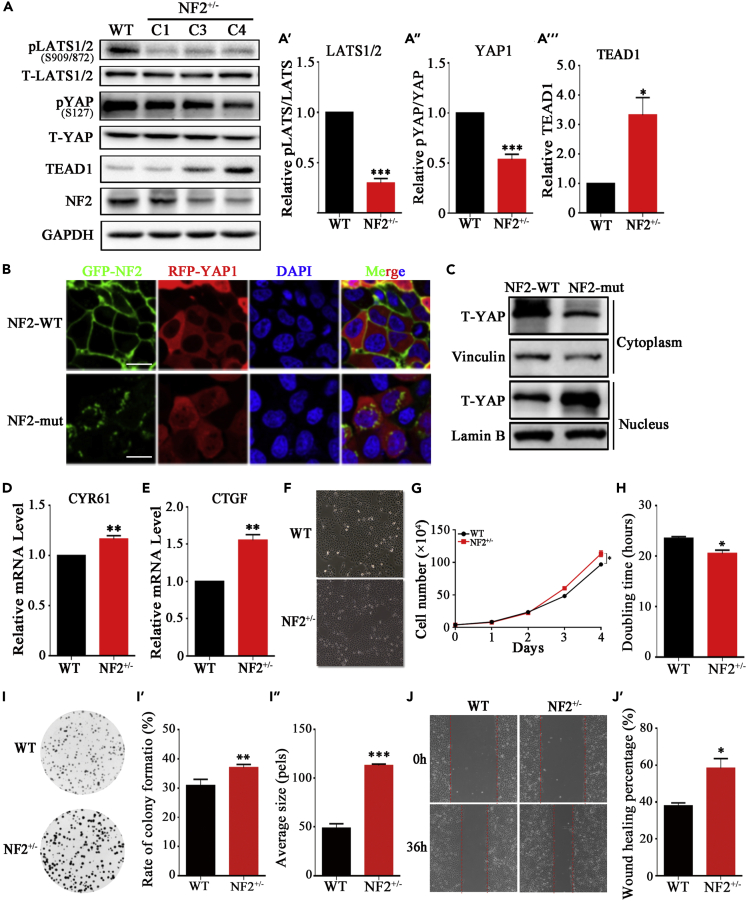
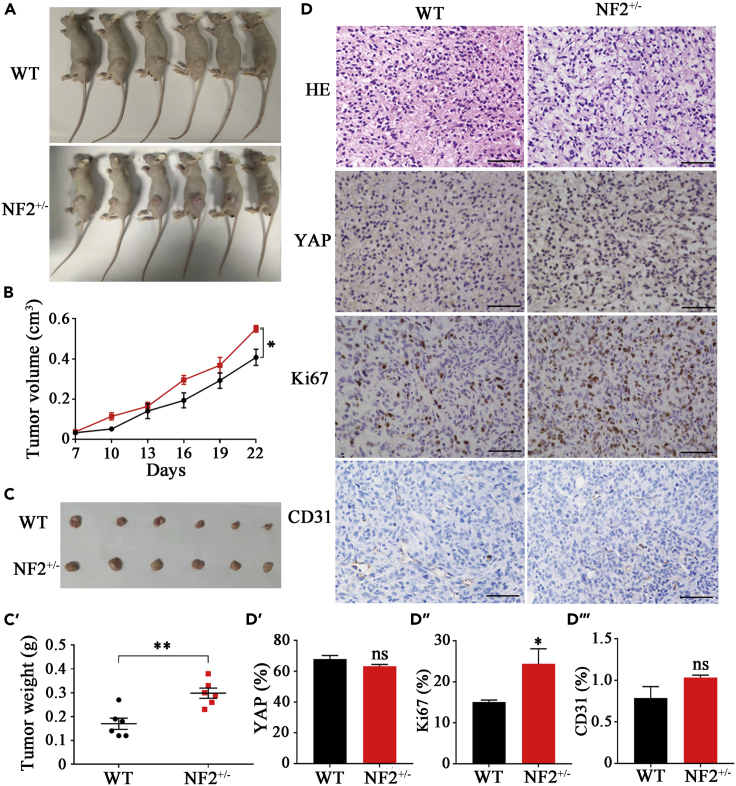
Neurofibromatosis type 2 is an autosomal dominant multiple neoplasia syndrome and is usually caused by mutations in the neurofibromin 2 (NF2) gene, which encodes a tumor suppressor and initiates the Hippo pathway. However, the mechanism by which NF2 functions in the Hippo pathway isn't fully understood. Here we identified a NF2 c.770-784del mutation from a neurofibromatosis type 2 family. MD simulations showed that this mutation significantly changed the structure of the F3 module of the NF2-FERM domain. Functional assays indicated that the NF2 c.770-784del variant formed LLPS in the cytoplasm with LATS to restrain LATS plasma membrane localization and inactivated the Hippo pathway. Besides, this deletion partly caused a skipping of exon 8 and reduced the protein level of NF2, collectively promoting proliferation and tumorigenesis of meningeal cells. We identified an unrecognized mechanism of LLPS and splicing skipping for the NF2-induced Hippo pathway, which provided new insight into the pathogenesis of neurofibromatosis type 2.

Keywords: Clinical genetics; Functional aspects of cell biology; Pathophysiology.


Conflict of interest statement

The authors declare no competing interests.

Figures

None
Graphical abstract
Figure 1
Figure 1
A novel c.770-784del variant of the NF2 gene was identified (A) The Chinese neurofibromatosis type 2 pedigree. Affected individuals are indicated by filled symbols. The arrow denotes the proband. (B) MRI features of IV-3 (1B/a, 1B/b, 1B/c) and III-4 (1B/d, 1B/e, 1B/f). (C) Histological features of IV-3 (1C/a, 1C/b, 1C/c) and III-4 (1C/d, 1C/e, 1C/f). (D) Partial sequencing chromatograms of PCR products of the NF2 gene. See also Figure S1. (E) Partial sequencing chromatograms showing the c.770-784del of NF2. (F) PCR-PAGE analysis for the c.770-784del of NF2. (G-I) MD simulations on FERM domain. (G) RMSD curves for the Cα atoms of the FERM domain. (H) RMSF for the Cα atoms of the FERM domain. (I) Overlay of the structures of the FERM domain in wild-FERM and mutant-FERM at the end of the simulation. See also Table S1. (J–M) MD simulations on NF2 protein. RMSD curves versus simulation times for the wild-type NF2 (J) and mutant NF2 (K). Structures of the wild-type NF2 (L) and mutant NF2 (M) at the end of the simulation. See also Table S1.
Figure 2
Figure 2
NF2 mutant showed restricted binding to the plasma membrane (A) pEGFP-NF2-WT, pEGFP-NF2-mut and pEGFP were expressed in HEK293T cells, respectively. The immunofluorescence pattern of transfected HEK293T cells was double-labeled with CellMask™ and GFP. Scale bar, 50μm. See also Figure S2A. (B) The Lipid dot-blot assay confirmed the interaction between PA with NF2. See also Figure S2B. (C) Time-series fluorescence microscopy analysis of GFP-NF2 puncta. Bottom row shows zoom-in view of two fusing puncta. Scale bar, 10μm (top) and 1μm (bottom). See also Video S1. (D) Representative micrographs of GFP-NF2 puncta before and after photobleaching. Scale bar, 0.2μm. See also Figure S3. (D′) Quantification of fluorescence intensity recovery in the bleached region of GFP-NF2 puncta. Error bars, SEM of three independent experiments. (E) NF2-mut contained an IDR. (F) GFP-NF2-mutΔIDR were expressed in HEK293T cells. The immunofluorescence pattern of NF2-mutΔIDR puncta. Scale bar, 20μm. (F′) Quantification of puncta per cell. Error bars, SEM of three micrographs. nsP>0.05, Student’s t test. (G) Time-series fluorescence microscopy analysis of NF2-mutΔIDR puncta. Bottom row shows zoom-in view of two fusing puncta. Scale bar, 10μm (top) and 1μm (bottom). See also Video S2. (H) Representative micrographs of NF2-mutΔIDR puncta before and after photobleaching. Scale bar, 0.2μm. (H′) Quantification of fluorescence intensity recovery in the bleached region of NF2-mutΔIDR puncta. Error bars, SEM of three independent experiments. (I) No in vitro liquid droplets of either NF2-WT, NF2-mut or NF2-mutΔIDR proteins.
Figure 3
Figure 3
NF2 mutant restricted the recruitment of LATS to the plasma membrane and formed LLPS of NF2-LATS in the cytoplasm (A) The pRFP-LATS only, pRFP-LATS and pEGFP-NF2-WT, pRFP-LATS and pEGFP-NF2-mut, pRFP-LATS and pEGFP-NF2-mut BDdel were expressed in HEK293T cells, respectively. The immunofluorescence pattern of in transfected HEK293T cells. The number (A′) and size (A″) of puncta were quantified. Scale bar, 20μm. See also Figure S4. (B) Phase-separation assays of LATS, LATS and NF2-WT, LATS and NF2-mut proteins in vitro. Scale bar, 20μm. (C) Time-series fluorescence microscopy analysis of LATS, LATS and NF2-WT, LATS and NF2-mut. Scale bar, 20μm. (D, D′) in vitro FRAP assay and quantification of LATS and NF2-WT puncta. (E, E′) in vitro FRAP assay and quantification of LATS and NF2-mut puncta. (F, F′) in vitro FRAP assay and quantification of LATS puncta. Time 0s indicates the photobleaching pulse. Scale bar, 20μm. Error bars, SEM of three independent experiments. Data are represented as mean ± SEM ∗∗∗p < 0.001, Student’s t test.
Figure 4
Figure 4
Construction and identification of meningioma cell line with NF2 c.770-784 heterozygous deletion (A) Schematic diagram of guide RNA and pMD19-NF2-mut construction using the CRISPR/Cas9 system. (B) Partial sequencing chromatograms of NF2+/− from gene-edited cells. (C) NF2 mRNA identification of gene-edited cells. (D) The sequence chromatograms of partial cDNA sequences of WT-IOMM and NF2+/−IOMM. (E) The schematic diagram of pSPL3-NF2-mut plasmids. (F) Partial sequence chromatograms and gel electrophoresis of RT-PCR products in pSPL3-NF2 (WT or mut) transfected cells. (G) The schematic diagram of splicing both in WT-IOMM and NF2+/−IOMM.
Figure 5
Figure 5
NF2 mutant promoted cell proliferation through inactivating Hippo pathway (A, A′, A″, A‴) Western blotting and quantification of NF2, LATS1/2, YAP and TEAD. GAPDH is shown as a loading control. (B) The immunofluorescence pattern of RFP-YAP1 and GFP-NF2 in HEK293T cells, which were transfected with exogenous GFP-NF2 (WT or mut) and RFP-YAP1. Scale bar, 50μm. (C) Western blotting of YAP subcellular fractionation. Vinculin and Lamin B are shown as loading control of cytoplasm and nucleus, respectively. (D and E) Relative expression level of CTGF and CYR61 by qPCR. (F) Observation of WT-IOMM and NF2+/−IOMM meningioma cells under light microscope. (G) Growth curve of WT-IOMM and NF2+/−IOMM meningioma cells. Error bars, SEM of three micrographs. (H) Doubling time of WT-IOMM and NF2+/−IOMM meningioma cells. (I, I′, I″) Observation, quantification on rate of clone formation and clone size of WT-IOMM and NF2+/−IOMM meningioma cells. (J, J′) Observation and quantification on in vitro wound-healing assay of WT-IOMM and NF2+/−IOMM meningioma cells. Error bars, SEM of three independent experiments. Data are represented as mean ± SEM ∗p < 0.05, ∗∗p < 0.01, ∗∗∗p < 0.001, Student’s t test.
Figure 6
Figure 6
NF2 mutant increased tumorigenicity (A) Immunocompromised mice were implanted with WT-IOMM or NF2+/−IOMM meningioma cells. (B) Growth curve of xenograft tumors from mice implanted with WT-IOMM and NF2+/−IOMM meningioma cells. (C, C′) Harvests and quantification of xenograft tumors from mice implanted with WT-IOMM and NF2+/−IOMM meningioma cells. (D, D′, D″, D‴) Immunohistochemistry and quantification of HE, YAP, Ki67 and CD31 of tumor from mice implanted with WT-IOMM and NF2+/−IOMM meningioma cells. Error bars, SEM of three independent experiments. Data are represented as mean ± SEM nsP>0.05, ∗p < 0.05, ∗∗p < 0.01, Student’s t test.

Similar articles

Cited by

References

    1. Anna A., Monika G. Splicing mutations in human genetic disorders: examples, detection, and confirmation. J. Appl. Genet. 2018;59:253–268. doi: 10.1007/s13353-018-0444-7. - DOI - PMC - PubMed
    1. Asthagiri A.R., Parry D.M., Butman J.A., Kim H.J., Tsilou E.T., Zhuang Z., Lonser R.R. Neurofibromatosis type 2. Lancet (London, England) 2009;373:1974–1986. doi: 10.1016/S0140-6736(09)60259-2. - DOI - PMC - PubMed
    1. Baser M.E., Contributors to the International NF2 Mutation Database The distribution of constitutional and somatic mutations in the neurofibromatosis 2 gene. Hum. Mutat. 2006;27:297–306. doi: 10.1002/humu.20317. - DOI - PubMed
    1. Brangwynne C.P., Eckmann C.R., Courson D.S., Rybarska A., Hoege C., Gharakhani J., Jülicher F., Hyman A.A. Germline P granules are liquid droplets that localize by controlled dissolution/condensation. Science. 2009;324:1729–1732. doi: 10.1126/science.1172046. - DOI - PubMed
    1. Bretscher A., Edwards K., Fehon R.G. ERM proteins and merlin: integrators at the cell cortex. Nat. Rev. Mol. Cell Biol. 2002;3:586–599. doi: 10.1038/nrm882. - DOI - PubMed