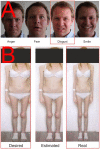
The sight of one's own body: Could qEEG help predict the treatment response in anorexia nervosa?
- PMID: 36300071
- PMCID: PMC9592122
- DOI: 10.3389/fpsyg.2022.958501
The sight of one's own body: Could qEEG help predict the treatment response in anorexia nervosa?
Abstract
Aims of the study: The study aims to identify the differences in brain activity between participants with anorexia nervosa and healthy control using visual stimulus conditions combined with the quantitative dense-array EEG recording analysis method called Brain Activation Sequences (BAS).
Materials and methods: 23 participants with anorexia nervosa and 21 healthy controls were presented with visual stimuli, including the subject's facial expressions and body images. The 128-channel EEG data were processed using BAS and displayed as activity in up to 66 brain regions. Subsequent cluster analysis was used to identify groups of participants exhibiting area-specific activation patterns.
Results: Cluster analysis identified three distinct groups: one including all healthy controls (HC) and two consisting of all participants with anorexia (AN-I with 19 participants and AN-II with four participants). The AN-I and AN-II groups differed in their response to treatment. Comparisons of HC vs. AN confirmed the dominance of the right cerebral hemisphere in participants with anorexia nervosa in two of the three reported conditions. The facial expressions condition, specifically the facial reaction expressing disgust, indicates the existence of a social attentional bias toward faces, whereas emotions remained undetected in participants. High limbic activity, medial frontal gyrus involvement, low fusiform cortex activity, and milder visual cortex activity in healthy controls compared to participants indicate that the facial expression stimulus is perceived by healthy subjects primarily as an emotion, not as the face itself. In the body image condition, participants showed higher activity in the fusiform gyrus and right insula, indicating activation of the brain's "fear network."
Conclusion: The study describes a specific pattern of brain activation in response to facial expression of disgust and body images that likely contributes to social-cognitive and behavioral impairments in anorexia. In addition, the substantial difference in the pattern of brain activation within the participants with AN and its association with treatment resistance deserves special attention because of its potential to develop a clinically useful prediction tool and identify potential targets for, for example, neuromodulatory treatments and/or individualized psychotherapy.
Keywords: anorexia nervosa; disgust; facial expressions; perception; qEEG; treatment response.
Copyright © 2022 Susta, Bizik, Yamamotova, Petranek, Kadochova and Papezova.
Conflict of interest statement
The authors declare that the research was conducted in the absence of any commercial or financial relationships that could be construed as a potential conflict of interest.
Figures


Similar articles
-
Sex differences in neural activation to facial expressions denoting contempt and disgust.PLoS One. 2008;3(11):e3622. doi: 10.1371/journal.pone.0003622. Epub 2008 Nov 5. PLoS One. 2008. PMID: 18985147 Free PMC article. Clinical Trial.
-
The impact of intranasal oxytocin on attention to social emotional stimuli in patients with anorexia nervosa: a double blind within-subject cross-over experiment.PLoS One. 2014 Mar 6;9(6):e90721. doi: 10.1371/journal.pone.0090721. eCollection 2014. PLoS One. 2014. PMID: 24603863 Free PMC article. Clinical Trial.
-
Evaluation of visual food stimuli paradigms on healthy adolescents for future use in fMRI studies in anorexia nervosa.J Eat Disord. 2023 Mar 6;11(1):35. doi: 10.1186/s40337-023-00761-8. J Eat Disord. 2023. PMID: 36879292 Free PMC article.
-
The role of body image and self-perception in anorexia nervosa: the neuroimaging perspective.J Neuropsychol. 2018 Mar;12(1):41-52. doi: 10.1111/jnp.12106. Epub 2016 May 25. J Neuropsychol. 2018. PMID: 27220759 Review.
-
Visual processing in anorexia nervosa and body dysmorphic disorder: similarities, differences, and future research directions.J Psychiatr Res. 2013 Oct;47(10):1483-91. doi: 10.1016/j.jpsychires.2013.06.003. Epub 2013 Jun 27. J Psychiatr Res. 2013. PMID: 23810196 Free PMC article. Review.
Cited by
-
Behavioral, neuronal, and physiological facets of multidimensional body image in anorexia nervosa: a scoping review.J Eat Disord. 2025 Feb 10;13(1):23. doi: 10.1186/s40337-025-01191-4. J Eat Disord. 2025. PMID: 39930528 Free PMC article. Review.
References
-
- American Psychiatric Association. Dsm-5 Task Force (2013). Diagnostic and Statistical Manual of Mental Disorders: Dsm-5, Washington D.C.: American Psychiatric Association.
-
- Banoczi W. (2005). How some drugs affect the electroencephalogram (Eeg). Am. J. Electroneurodiagnost.Technol. 45, 118–129. - PubMed
LinkOut - more resources
Full Text Sources
Research Materials

