. 2022 Oct 10:13:965708.
doi: 10.3389/fimmu.2022.965708. eCollection 2022.

ATF6α contributes to rheumatoid arthritis by inducing inflammatory cytokine production and apoptosis resistance

Affiliations

ATF6α contributes to rheumatoid arthritis by inducing inflammatory cytokine production and apoptosis resistance

Luna Ge et al. Front Immunol. .

Abstract

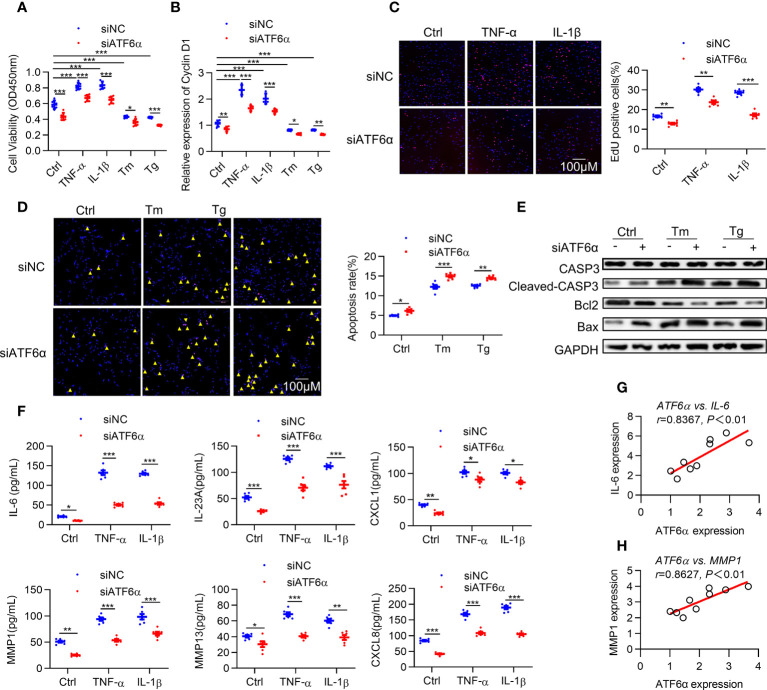
Objective: The contribution of activating transcription factor 6α (ATF6α) in rheumatoid arthritis (RA) pathogenesis, especially on fibroblast-like synoviocytes (FLSs), has been suggested by its sensitivity to inflammatory stimulus. However, the exact role and therapeutic potential of ATF6α in RA remains to be fully elucidated.

Methods: ATF6α expression was determined in joint tissues and FLS, and gain-of-function and loss-of-function analyses were applied to evaluate the biological roles of ATF6α in RA FLSs. A murine collagen-induced arthritis (CIA) model, combining both gene deletion of ATF6α and treatment with the ATF6α inhibitor Ceapin-A7, was employed. Joint inflammation, tissue destruction, circulating levels of inflammatory cytokines were assessed in CIA mice. Transcriptome sequencing analysis (RNASeq), molecular biology, and biochemical approaches were performed to identify target genes of ATF6α.

Results: ATF6α expression was significantly increased in synovium of RA patients and in synovium of mice subjected to CIA. ATF6α silencing or inhibition repressed RA FLSs viability and cytokine production but induced the apoptosis. CIA-model mice with ATF6α deficiency displayed decreased arthritic progression, leading to profound reductions in clinical and proinflammatory markers in the joints. Pharmacological treatment of mice with Ceapin-A7 reduced arthritis severity in CIA models. RNA-sequencing of wild-type and knockdown of ATF6α in RA FLSs revealed a transcriptional program that promotes inflammation and suppresses apoptosis, and subsequent experiments identified Baculoviral IAP Repeat Containing 3 (BIRC3) as the direct target for ATF6α.

Conclusion: This study highlights the pathogenic role of ATF6α-BIRC3 axis in RA and identifies a novel pathway for new therapies against RA.

Keywords: ATF6α; BIRC3; apoptosis resistance; inflammation; rheumatoid arthritis; unfolded protein response.


Conflict of interest statement

The authors declare that the research was conducted in the absence of any commercial or financial relationships that could be construed as a potential conflict of interest.

Figures

Figure 1
Figure 1
Expression of ATF6α in RA. ATF6α mRNA (A) and protein (B) expression was assessed in RA FLSs and OA FLSs. (C) ATF6α mRNA expression was assessed by qPCR in the knee joints from normal DBA1 mice (Ctrl) and CIA mice. (D) ATF6α mRNA expression levels were measured by qPCR in indicated cells from RA patients. (E) RA FLSs were stimulated with TNF-α (10 ng/mL) or IL-1β (10 ng/mL) for 24 h and ATF6α mRNA expression was assessed by qPCR. (F–H) RA FLSs were pretreated with (+) or without (-) 300 μM AEBSF for 1 h and subsequent TNF-α (10 ng/mL) or IL-1β (10 ng/mL) for the indicated time periods (F) or 6h (G, H). (F, G), Western blotting was performed to detect ATF6a and GRP78 expression. (H), The cells were then stained with anti-ATF6α antibody (red signal) and DAPI (blue signal). Representative images are shown at 40X magnification. Data were expressed as mean ± SD (n = 9), n represent biologically independent samples (A, C–E). The data were analyzed using two-tailed unpaired Student’ s t test (A, C) and one-way ANOVA (D, E). **P < 0.01, ***P < 0.001. ATF6α(N): N-terminal fragment of ATF6α; AEBSF: 4-(2-aminoethyl) benzenesulfonyl fluoride.
Figure 2
Figure 2
ATF6α is required for the aggressive phenotype of RA FLSs. RA FLSs were transfected with ATF6α-siRNA (siATF6α) or the control (siNC) for 72 h and subsequent vehicle (Ctrl), TNF-α (10 ng/mL), IL-1β (10 ng/mL), Tm (2μg/mL), or Tg (300 nM) for another 72 h (A), 6 h (B) or 24h (C–F). (A), Cell viability was detected via CCK-8 assay. (B) Total cellular RNA was extracted, and cyclin D1 mRNA expression was analyzed by qPCR. (C) Cell proliferation was determined by EdU staining, and EdU incorporation was calculated as EdU-positive cells/total cells and quantified by ImageJ. (D) Apoptosis was evaluated by TUNEL assay and expressed as percentage of TUNEL-positive cells. (E) Total protein was extracted for Western blot detection of CASP3, Cleaved-CAPS3, Bcl2, and Bax. (F) Cytokine levels in cell culture supernatants were measured by ELISA. (G, H), Correlations of cytokines (IL-6 and MMP1) and ATF6α expression. Data were expressed as mean ± SD(n=6), n represent biologically independent samples (A, B, F) or fields of view (C, D). The data were analyzed using two-way ANOVA (A–D, F) and Spearman correlation analysis. *P < 0.05, **P < 0.01, ***P < 0.001. Tm, tunicamycin; Tg, thapsigargin. The yellow triangle symbol marks TUNEL-positive cells.
Figure 3
Figure 3
ATF6α deficiency delays CIA development. (A–C), Incidence, arthritis score, and hind paw thickness of CIA in WT and ATF6α KO mice from day 22 to day 45. (D), Representative photographs of the fore and hind paws of CIA in WT and ATF6α KO mice on day 45. (E), Representative H&E staining of inter-phalangeal joints and ankle joints. (F), Micro-CT representative images of hind paws. (G), Quantitative analysis results from micro-CT evaluation. (H), IL-6, IL-8, TNF-α, and IL-1β were measured in mice serum by ELISA. Data were expressed as mean ± SD (n = 9) and analyzed using the non-parametric Mann-Whitney test (B), two-way ANOVA analysis (C), and two-tailed unpaired Student’ s t test (G, H). n represent biologically independent mice (A-C, G, H). *P < 0.05, **P < 0.01, ***P < 0.001. Tb.Th, trabecular thickness; Tb.BMD, trabecular bone mineral density; Tb.N, trabecular number; Tb.Sp, trabecular separation.
Figure 4
Figure 4
Ceapin-A7 delays CIA development. (A, B), Arthritis score and hind paw thickness of CIA from day 22 to day 45 in indicated groups of CIA mice. (C), Representative photographs of the fore and hind paws of CIA and control mice on day 45. (D), Representative H&E staining of knee joints from CIA mice and the control mice. (E), Micro-CT representative images of hind paws. (F), Quantitative analysis from micro-CT evaluation. (G), Mice serum levels of IL-6, IL-8, TNF-α, and IL-1β were measured by ELISA. Data were expressed as mean ± SD (n = 9 in per group), n represent biologically independent mice (A, B, F, G). The data were analyzed using two-way ANOVA analysis. *P<0.05, **P<0.01, ***P<0.001. Tb.Th: trabecular thickness; Tb.BMD: trabecular bone mineral density, Tb.N: trabecular number; Tb.Sp: trabecular separation, ETC: etanercept.
Figure 5
Figure 5
Identification of BIRC3 as the target gene of ATF6α. (A), Volcano plot of differentially expressed genes (DEGs) upon ATF6α knockdown as derived from RNASeq. (B), KEGG enrichment analysis of DEGs was performed, and representative pathways (P<0.05) were listed. (C), Venn diagram of genes of NF-kappa B signaling pathway and apoptosis pathway. (D–H), RA FLSs were transfected with ATF6α-siRNA for 72 h (D, E), followed by treatment with TNF-α or IL-1β for another 24 h (F, G). RA FLSs were treated with ceapin-A7 (0, 1, 2, or 5 μM) for 24 h. BIRC2, BIRC3 or NFKB1 expression was analyzed by qPCR (D, F, H) and Western blot (E, G, I). (J, K), RA FLSs were treated with TNF-α (10 ng/mL), IL-1β (10 ng/mL), Tm (2 μg/mL), or Tg (300 nM) for 6 h. ChIP analysis was performed. (L) MEF cells isolated from ATF6α+/+ and ATF6α-/- mice were treated with the vehicle (Ctrl), TNF-α (10 ng/mL), or IL-1β (10 ng/mL) for 24 h. BIRC3 expression was measured by qPCR. Data were expressed as mean ± SD (n = 6) and analyzed using two-way ANOVA. n represent biologically independent samples (D, F, H, L). *P<0.05, **P<0.01, ***P<0.001. ATF6α(N): N-terminal fragment of ATF6α; Tm: tunicamycin; Tg: thapsigargin.
Figure 6
Figure 6
BIRC3 regulates inflammation and apoptosis of RA FLSs. RA FLSs were co-transfected with negative control siRNA (siNC) or ATF6α siRNA (siATF6α) plus empty lentivirus (Lv-Ctrl) or BIRC3-overexpressing lentivirus (Lv-BIRC3) in the presence of Tm or Tg for 72 h. (A), IL-6, IL-23A, ICAM1, VCAM1, CXCL1, CXCL8, MMP1 and MMP13 levels in cell culture supernatants were measured by ELISA. (B), EdU assay was performed after overexpressing BIRC3 in ATF6α-silenced RA FLSs for 72 h in the presence of TNF-α or IL-1β (10 ng/mL). EdU incorporation was calculated as EdU + cells/total cells per field, quantified by Image J. (C), Apoptosis of RA FLSs was detected by TUNEL assay. The data are expressed as the percentage of TUNEL-positive cells per field. (D), Total protein was extracted for Western blot detection of Cleaved-CASP3, Bcl2, and Bax. (E), Correlations of BIRC3 and ATF6α expression. Pearson’s correlation coefficient (r) and P value are shown. Data are mean ± SD(n=6) and analyzed using one-way ANOVA (A–C) or Pearson correlation analysis (E). n represent biologically independent samples (A) or fields of view (B, C). *P < 0.05, **P < 0.01, ***P < 0.001. Tm. tunicamycin; Tg, thapsigargin. The yellow triangle symbol marks TUNEL-positive cells.

Similar articles

Cited by

References

    1. Derer A, Böhm C, Grötsch B, Grün JR, Grützkau A, Stock M, et al. . Rsk2 Controls synovial fibroblast hyperplasia and the course of arthritis. Annals rheumatic Dis (2016) 75(2):413–21. doi: 10.1136/annrheumdis-2014-205618 - DOI - PubMed
    1. Falconer J, Murphy AN, Young SP, Clark AR, Tiziani S, Guma M, et al. . Review: Synovial cell metabolism and chronic inflammation in rheumatoid arthritis. Arthritis Rheumatol (Hoboken NJ) (2018) 70(7):984–99. doi: 10.1002/art.40504 - DOI - PMC - PubMed
    1. Bartok B, Firestein GS. Fibroblast-like synoviocytes: Key effector cells in rheumatoid arthritis. Immunol Rev (2010) 233(1):233–55. doi: 10.1111/j.0105-2896.2009.00859.x - DOI - PMC - PubMed
    1. Yang X, Guo Q, Feng T, Lu Q, Ge L, Pan J, et al. . Il13rα1 protects against rheumatoid arthritis by combating the apoptotic resistance of fibroblast-like synoviocytes. Arthritis Res Ther (2020) 22(1):184. doi: 10.1186/s13075-020-02270-4 - DOI - PMC - PubMed
    1. Karami J, Masoumi M, Khorramdelazad H, Bashiri H, Darvishi P, Sereshki HA, et al. . Role of autophagy in the pathogenesis of rheumatoid arthritis: Latest evidence and therapeutic approaches. Life Sci (2020) 254:117734. doi: 10.1016/j.lfs.2020.117734 - DOI - PubMed

Publication types