

IAnimal: a cross-species omics knowledgebase for animals
- PMID: 36300629
- PMCID: PMC9825575
- DOI: 10.1093/nar/gkac936
IAnimal: a cross-species omics knowledgebase for animals
Abstract
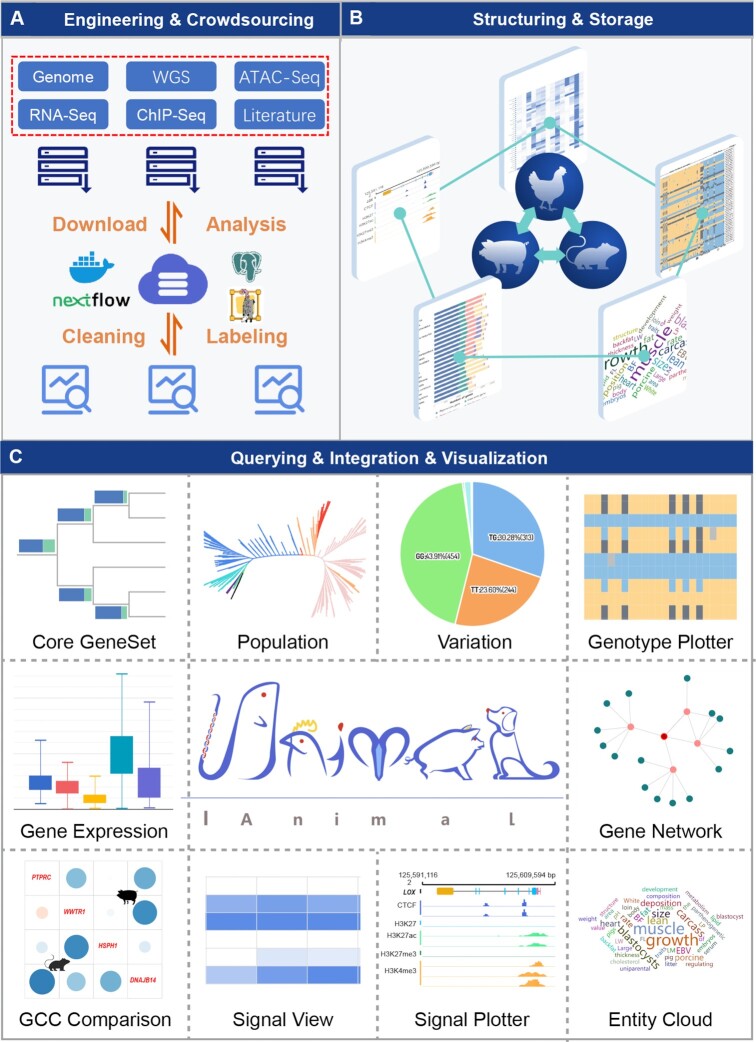
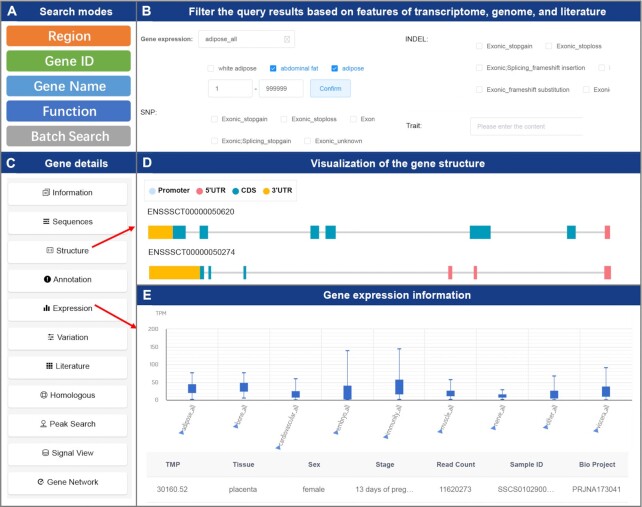
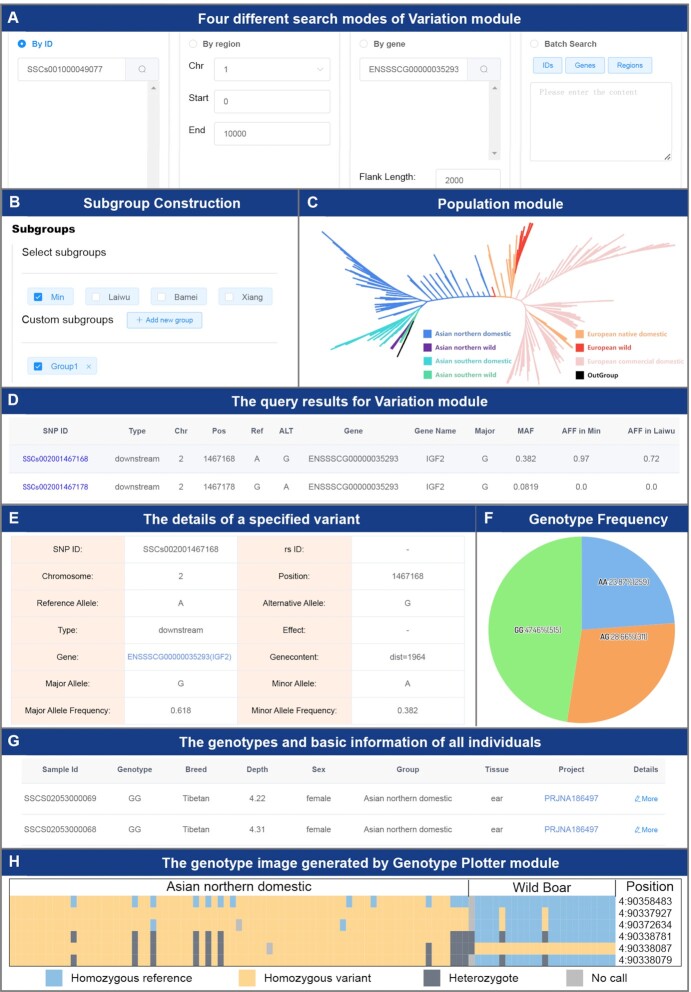
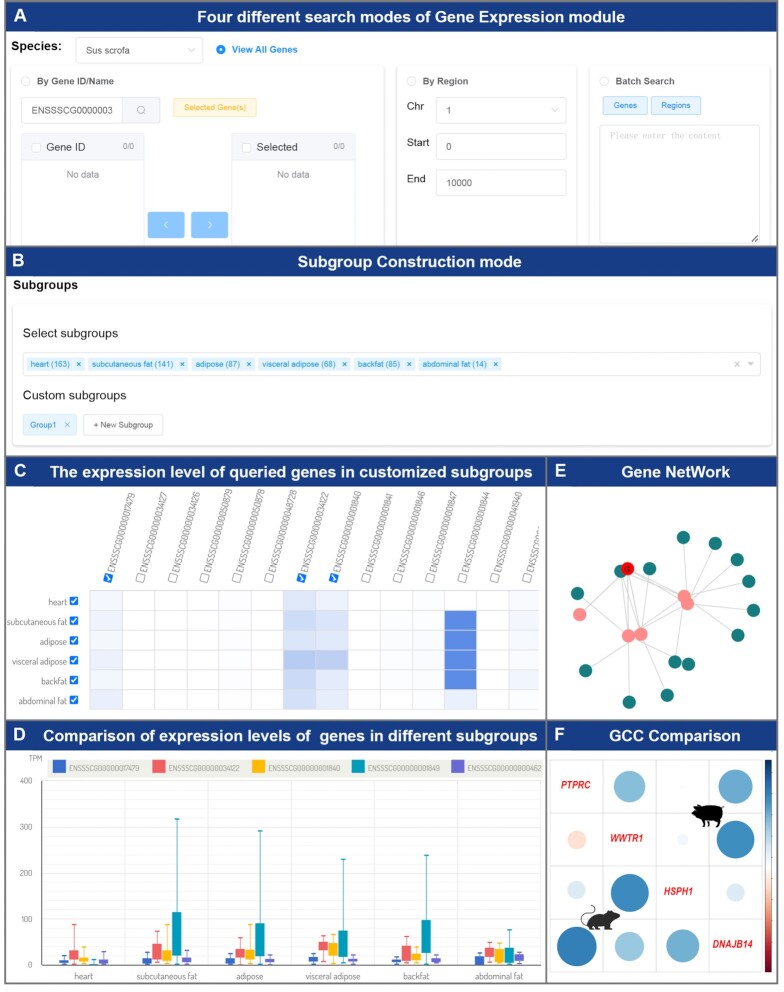
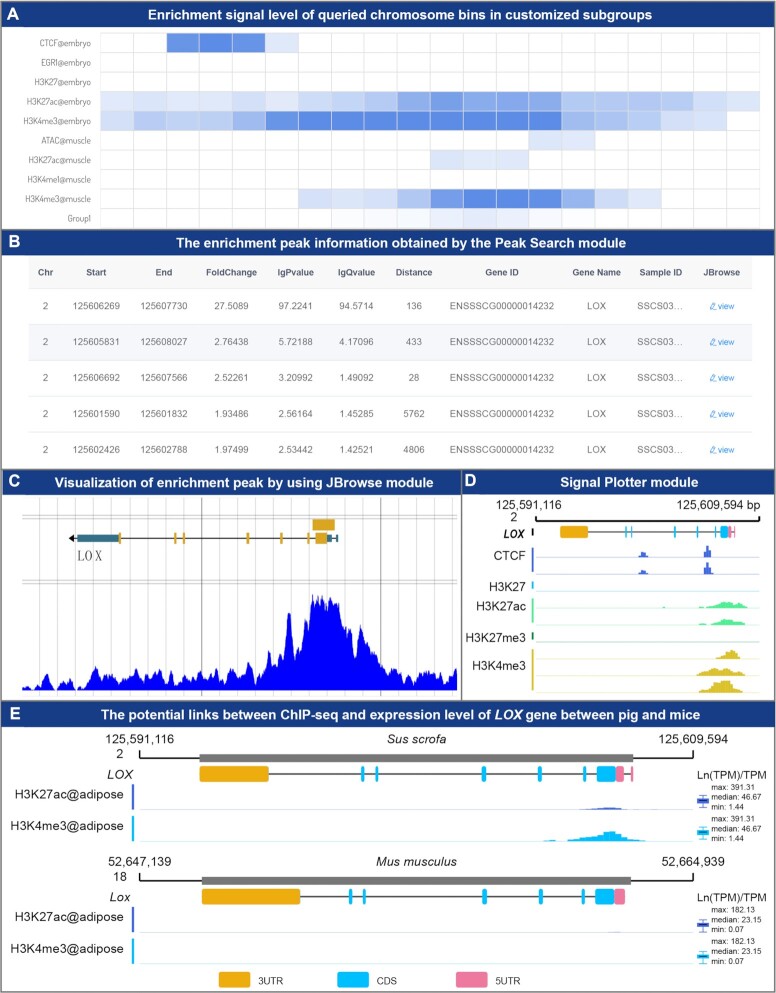
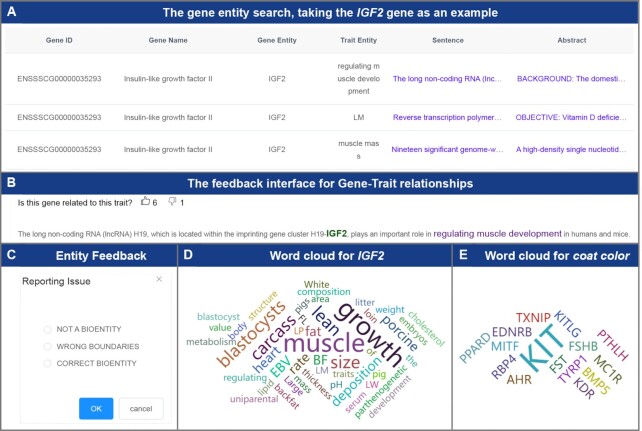
With the exponential growth of multi-omics data, its integration and utilization have brought unprecedented opportunities for the interpretation of gene regulation mechanisms and the comprehensive analyses of biological systems. IAnimal (https://ianimal.pro/), a cross-species, multi-omics knowledgebase, was developed to improve the utilization of massive public data and simplify the integration of multi-omics information to mine the genetic mechanisms of objective traits. Currently, IAnimal provides 61 191 individual omics data of genome (WGS), transcriptome (RNA-Seq), epigenome (ChIP-Seq, ATAC-Seq) and genome annotation information for 21 species, such as mice, pigs, cattle, chickens, and macaques. The scale of its total clean data has reached 846.46 TB. To better understand the biological significance of omics information, a deep learning model for IAnimal was built based on BioBERT and AutoNER to mine 'gene' and 'trait' entities from 2 794 237 abstracts, which has practical significance for comprehending how each omics layer regulates genes to affect traits. By means of user-friendly web interfaces, flexible data application programming interfaces, and abundant functional modules, IAnimal enables users to easily query, mine, and visualize characteristics in various omics, and to infer how genes play biological roles under the influence of various omics layers.
© The Author(s) 2022. Published by Oxford University Press on behalf of Nucleic Acids Research.
Figures
Similar articles
-
PIGOME: An Integrated and Comprehensive Multi-omics Database for Pig Functional Genomics Studies.Genomics Proteomics Bioinformatics. 2025 May 10;23(1):qzaf016. doi: 10.1093/gpbjnl/qzaf016. Genomics Proteomics Bioinformatics. 2025. PMID: 40036767 Free PMC article.
-
EXPRESSO: a multi-omics database to explore multi-layered 3D genomic organization.Nucleic Acids Res. 2025 Jan 6;53(D1):D79-D90. doi: 10.1093/nar/gkae999. Nucleic Acids Res. 2025. PMID: 39498488 Free PMC article.
-
scCancerExplorer: a comprehensive database for interactively exploring single-cell multi-omics data of human pan-cancer.Nucleic Acids Res. 2025 Jan 6;53(D1):D1526-D1535. doi: 10.1093/nar/gkae1100. Nucleic Acids Res. 2025. PMID: 39558175 Free PMC article.
-
[From genome analysis to construction of an integrated omics knowledgebase for crops].Yi Chuan. 2019 Sep 20;41(9):875-882. doi: 10.16288/j.yczz.19-121. Yi Chuan. 2019. PMID: 31549685 Review. Chinese.
-
Transcriptional regulation in plants: Using omics data to crack the cis-regulatory code.Curr Opin Plant Biol. 2021 Oct;63:102058. doi: 10.1016/j.pbi.2021.102058. Epub 2021 Jun 5. Curr Opin Plant Biol. 2021. PMID: 34098218 Review.
Cited by
-
TCOD: an integrated resource for tropical crops.Nucleic Acids Res. 2024 Jan 5;52(D1):D1651-D1660. doi: 10.1093/nar/gkad870. Nucleic Acids Res. 2024. PMID: 37843152 Free PMC article.
-
Genomic prediction accounting for dominance and epistatic genetic effects on litter size traits in Large White pigs.J Anim Sci. 2025 Jan 4;103:skaf004. doi: 10.1093/jas/skaf004. J Anim Sci. 2025. PMID: 39774780
-
Research Progress and Applications of Bovine Genome in the Tribe Bovini.Genes (Basel). 2024 Apr 18;15(4):509. doi: 10.3390/genes15040509. Genes (Basel). 2024. PMID: 38674443 Free PMC article. Review.
-
The 1000 Chinese Indigenous Pig Genomes Project provides insights into the genomic architecture of pigs.Nat Commun. 2024 Nov 22;15(1):10137. doi: 10.1038/s41467-024-54471-z. Nat Commun. 2024. PMID: 39578420 Free PMC article.
-
FarmGTEx TWAS-server: An Interactive Web Server for Customized TWAS Analysis.Genomics Proteomics Bioinformatics. 2025 May 10;23(1):qzaf006. doi: 10.1093/gpbjnl/qzaf006. Genomics Proteomics Bioinformatics. 2025. PMID: 39932890 Free PMC article.
References
-
- FAANG Consortium Giuffra E., Tuggle C.K.. Functional annotation of animal genomes (FAANG): current achievements and roadmap. Annu. Rev. Anim. Biosci. 2019; 7:65–88. - PubMed
Publication types
MeSH terms
LinkOut - more resources
Full Text Sources
